Forecasting extreme weather events
As I write this blog post, wildfires are ripping through the west coast of America. The biggest wildfires on record. This morning I was watching videos of the destruction that the fire left. Seeing distraught families come back to the homes in rubble. Many people could not claim insurance as the companies bowed out earlier due to the risk of wildfires. In northern California, a major industry there is wine production. I saw farmers rushing to pick grapes before the fire gets to them. Normally the farmer can wait till the grapes are ripe. But this time they had to collect all they can get. One town in California had a famous winery turned into rubble. The winery was a local landmark. Fires have burned over million acres of land.
While one of the wildfires started because people wanted to do a baby reveal party with polytechnics. The local climate did not help. Due to dry weather and windy weather. Making the dry vegetation work as fuel for the fire. And strong winds causing the fire to spread rapidly. As the climate generally gets warmer higher temperatures will be more normal. So experts say we need to get used to it as this is the new normal. In Colorado, temperatures dropped to around 2C with snow. Just coming from a record-breaking heatwave of 38.3C. The contrast is jarring. Between an inferno in Oregon and California and the below-freezing temperatures in Colorado.
As are weather system is complex and interconnected. People are saying that the changing weather is connected to typhoons in Asia. Affecting the local jet stream.
For extreme weather events like this. This is where short term forecasting comes along. According to climate.ai paper. People have been using ML techniques for a while to improve forecasting accuracy. Daily weather forecasts need to be produced every day and tested every day. So they can be accurate as possible before heading to the morning shows. Maybe ml can help analyse for data from the around the world. To predict weather events like this. Where we can see the connection between an event in another continent and how it would affect your local area. Which is important.
I watched a video of a Californian tech company. Using satellite data to access the risk of wildfires. Making them more precise. As insurance companies use normal maps. And block out whole neighbourhoods without going to a house by house basis. This may be the future of insuring people in fire-prone areas. As wildfires like this are forcing people to move outside the state entirely. But from watching the videos extra money will need to be put in in wildfire protection. One person in the town where it got to burn down. His house stayed put due to his wildfires mitigation techniques. Which included water hoses around the home. A battery and solar power back up if the grid gets disconnected. And fire protection liquid on to windows. But this set while very effective. Looked like it cost a lot of money. Probably in the ballpark. Of more than 60 grand. So these solutions are not available to everyone.
Climate Analytics
Recently I have been writing a lot about how we can use machine learning to help climate change. A lot of the idea from the paper climate.ai. Which tries to bridge the gap between the machine learning community and industries dealing with climate change. One of the areas that I found interesting lots of people don’t talk much about is climate analytics. Where data is collected about the climate which is then used to make financial decisions. Due to the large scale of climate change almost all countries and most industries will be affected. So, it will make sense to make sure that people do not lose out on their investments due to climate change.
Uses of collecting climate data
All of this will require a lot of data, in which machine learning is suited for. They may be some drawbacks. But I do think they will be useful. They are lots of areas that data can help financial investments. One example is flood risk, where focusing on the long-term risk will be useful for insurance companies. So, they can avoid large payouts. Wildfire risk is very similar which can burn through rural and suburb areas with a lot of woodlands. Costing landowners at a lot of money. Especially if you use land actively to create an income. Like using the land to raise cattle.
How data can be collected
The data can be collected in many ways. One increasingly popular area is remote sensing. Where we use satellite imagery to collect data of an area. This is done as the satellite can collect data in other wavelengths that are not visible to the human eye. So, we can view gases. View vegetation and track other elements. Remote sensing can have future use of enforcing regulations. Right now, a lot of satellite data covers wide pieces of an area of each image. Something hundreds of metres per image. So, you can’t be too precise in tracking a certain area. But as technology gets better, we can be able to pinpoint areas of high emissions. And see if a company is following regulations. But this leads to some privacy concerns.
For urban areas. Tracking the amount of movement using smartphones has been very useful. As people can track the usage of public transport and other services. Using information like that we can create incentives so people can use less carbon-heavy transportation rather than cars. This can help companies to invest in new transport methods by looking at supply and demand.
Energy is the most obvious example. Right now, a lot of energy companies are going bankrupt due to unprofitable energy sources, mainly coal. Because of COVID-19, other fossil companies had to size down. As lockdowns reduced the demand of many energy products, mainly oil. This forced lots of energy companies to chart a zero-carbon future. So, they survive the transition
Failing to implement my first paper
For the past week, I’ve been implementing a paper that creates labels on seismic images. This was done so I would implement another paper from the same authors that would make a convolutional network learn features from those labels. But I was not able to do so. I will be explaining why in the blog post.
In the beginning I found this paper which used weak labels to learn features of the images. But from reading the paper. I had to make the labels myself. So, I checked another paper they referenced which they made the labels. In that paper they made pixel-level labels from the general image labels. They had papers which featured their algorithm. One here, included a summary of the algorithm. Which is the first paper I found. And here is a second one which is more detailed. Which is the one I later used to help code the project.
Before I started coding the machine learning model to generate the labels. I did data exploration. The dataset I got was called LANDMASS. From the authors of the paper. It has thousands seismic images of the Netherlands North Sea. As that was a lot of data, I first looked at 10 images. I first had to convert the images from MATLAB file to a normal image. Which proved difficult in the beginning. But later got the hang of it, with the help of this medium article. And this formula, from stack overflow to convert the normalised data into normal pixels.
round((img + 1) * 255 / 2)

Figure 1 Chaotic Image
After I was able to get an idea of what the images look like. I started work on the machine learning model. To get the data needed for the model. I need to collect all of the images from the different categories. Which include chaotic, horizon, fault, and salt dome. Again, as the dataset included thousands of images. I chose 10 images per category. After I collected all the images. I used a K-means algorithm to initialise the feature matrix.
But later on, I missed one crucial factor, that the paper mentioned. The images were turned into vectors. So, I found a piece of code that turn images into vectors. I collected the images in vector in this time. The major algorithm used was Non-negative matrix factorization. But my computer did not have the packages required to do so.(At the time was going to use TensorFlow). So, I moved to Google Colab. Even though I did not use TensorFlow to make the NMF model. Using google colab was better as I was able to use google servers to compute my model. I used Scikit-learn NMF module instead. After that I made the labels after the model converged. After that I had use an argmax function on the columns. Then apply a median filter to get rid of noisy labels.
Then I plotted the labels. Then this is where the main problem arises. After I plotted the labels, they looked something like this:

This looked nothing like the labels were supposed to look. Here is the example from the research paper:

I reshaped the data numerous times and ways. And edited the NMF model. But not too much success. I don’t know how to move forward. As fixing the problem is not to clear. And have been googling around to find an answer. I also used slicing of the label data. So, it will be the same length an image in the dataset. But did not make the label much clearer.
After that I tried plot the images saved in the arrays. I eventually got it to work by using slicing. By slicing it like this [:256, 256]. Means 256 pixels rows and columns will be plotted. But one minor thing is that when using matplotlib image plotting unlike Pillow shows a type of blueish colour.

One of the solutions I tried was adding more data. So, added more 40 images per category. 50 images will be saved in each category. But did not change much. One solution I have not used is creating the NMF model from scratch. Basically, not using Scikit learn for NMF. And use something like TensorFlow. As the paper has their own NMF equation which uses a sparsity measure. To make up for the fact the label will be weak.


And I could also try to use a more custom k-means algorithm. But the paper does not add any detail for a custom k-means algorithm. So standard k-means algorithm may not be the issue.
Having the models more custom made may be the answer. As I think the main issue which is causing the problems is the shape of the data. Having a more custom model will show me how the data is being manipulated. Only problem is making the custom model is hard. And I need to translate the maths to code. One of the hardest bits when coding up the project was working out the Q variable.

And I still don’t know if I did that correctly. Especially for the hn variable which I had remove from the equation because I did not know what operator to add or how to define it in the equation. So even if did the custom model and reworked the Q value. Just due to the lack of knowledge translating the maths into code. Still may not be possible.
So, this is my first serious attempt of implementing a paper. I think its fine to say that I did not succeed. But I’ve learnt lots of new stuff. Like better knowledge of maths notation. And furthering my use of scikit learn. I will be trying to implement other papers soon.
Updated:
I copied a TensorFlow Implemented of NMF. Not much different. Trying to implement the papers multiplicative update rules is proving very difficult. As I’m struggling to understand the notation. Highlighted the problems that I’m struggling to read.

Throwing stuff at the wall
Right now as I’m writing this. I’ve been trying to use my programming and data science skills. To get some type of income. But as I don’t know how I would use those skills to get an income. I have been trying lots of new projects to see if they have potential. The most recent project was me implementing a research paper which made labels from seismic images. Which can be used for carbon sequestration. Granted I did not succeed but that’s for another article.
But hopefully, as I try all these projects. My skill level should improve. And I could be making more interesting projects. And if one of my projects becomes popular I can make a business from selling the software. But that’s mainly a long term goal. So right now I’m in the building stage of my expertise. Also trying to find ideas that can prove useful to somebody. Which was why I ended up on the seismic imaging. As I can imagine an energy company can use the software to find places to spot carbon storage areas. But when the project finishes I need to spend time again looking for another idea/project to work on. Which is something difficult as I try to find projects that are interesting and develop my skills. Basically not bog-standard tutorials like MNIST or titanic dataset.
But as deep learning and software engineering is wide a field. Any industry you can think of can use some type of ML model or software. The only threshold that it must be somehow useful. To find a new project idea I tend to do a lot of googling. Of topics, I’m thinking about at the moment. Or project ideas I have written about earlier. After I come up with an idea I write it down. Then I start researching how to do it. For the seismic images, the idea was saved earlier. So I just had to google it. I found multiple research papers. And skimmed through to see the one can I can do. From there pick resources that I could use for the project. For the seismic image project, I read the papers more thoroughly this time. To get an idea on how to build the project.
For other projects, I may have read other peoples blog post talking about how they build a similar product. Or an element of my project. Then I could start building a small prototype from there. After I build the prototype, I can optimise for things like the design. Or how the code is written. Depending on the project. I will want to ship the project. So I may use something like a docker-file which I used for the carbon dashboard project. Then publish on a cloud provider. Right now I’m using google cloud. But I have been thinking to use Microsoft Azure. After I do a write up of the process of how I made the project. And what I’ve learnt and how I can improve. As normally is something incomplete in these projects. As they are supposed to be a prototype.
We need worry about what AI can do now. Not AGI
Whenever something interesting happens in the deep learning world. There are always a few media articles talking about how the end is nigh. And it’s only a matter of time that we will have a HAL 2000 scenario. But anybody with little knowledge of the field knows that’s not happening. With the breakthrough. The AI has not got some superhuman reasoning abilities. regardless of how it may look. This is not to say we should be sleeping on the question of AGI. But I do think that’s a question we don’t have to deal with right now. But we should be instead of focusing on how AI is affecting our lives right now.
Machine learning is probably on all major software companies. Google, Microsoft, and apple. But these are not AGI that we mentioned earlier. But narrow AI in which a machine learning model has been trained on complete one specific task. Like movie recommendations, sharing engaging content. Gives good search results etc. This is the area that most AI progress is being made. As we now have AI that can classify images 95% correctly. But due to it being narrow AI that same AI can’t do something else. Like play chess. This is the research space called transfer learning. But as these machine learning models get more powerful the consequences of them are even more serious.
Facebook. A company that everyone that loves to hate. Because people don’t like The Zucc. Or worried about Facebook questionable handling of data. Facebook normally uses AI to promote content to people’s newsfeed. Where content can be shared to users most likely to read. In the west, this has led to some issues. Where people accuse Facebook of promoting polarising and inflammatory content to their user base. Also sharing misinformation. A less talked about topic but much more serious is Facebook in Myanmar. To give context Myanmar has gone through a strong wave of violence. In which the Rohingya Muslims are being kicked out of the country. The reason why Facebook relates to this. Most Burmese use Facebook. And Facebook has been a platform to promote hate speech in Myanmar. Leading to more violence.
These are the unintended consequences of having a machine learning model. They are many questions relating to Facebook. Like Facebook outsourcing moderating of content. With moderators, not understanding Burmese. Moderators with low-pay or lack of incentives to deal with bad posts correctly. This could happen if the machine learning model has no regulations.
This is a very nuanced issue. Because in the west (America). That it’s an issue of free speech vs speech with consequences. And in the west, Facebook is not helping promote violence. But less serious like data privacy violations. Or promoting partisan content. Even if the partisan/polarising content, It still more nuanced. As there is research saying that social media may not be the sole factor. And it may be mainly an older generation thing. As in America, the cable news network normally promotes the narrative. And promote their content into social media.
Amazon had to scrap an AI used for employing new people. As it was found out it was discriminating against women and people of colour. Obviously, the developers did not intentionally do this. But AI learned from the training data that the people that amazon wanted tended to be white and male. Which is not a fair algorithm. As it does not give people an equal chance.
Or another example from Facebook(also including, other social media companies). In which disinformation is shared with the user base. Real-life consequences are felt. The famous case of anti-vaxxers in which parents denying their child vaccination as they think it's harmful. This leads to numerous areas having measles outbreaks. Something that was supposed to be eradicated. Recently disinformation about the coronavirus is getting popular. Leading to people ignoring their local health guidelines. But like I mentioned earlier this is a very nuanced take. People saying that the coronavirus is fake or causes 5G. Have a good case on getting banned. But people talking about incoming science or areas that it’s not clear. Make it hard for tech companies to do a blanket ban. For example, at the beginning of the pandemic, the science of face masks was underwhelming. But later as the pandemic went on more research started saying masks are an effective way to deal with the virus. Before face masks got popular, they were people still promoting them. Should those people get banned?
This shows the problem of regulating speech on social media platforms. And these are the philosophy and moral problems. If you solved all these issues overnight and got an AI correctly identifying problematic speech. And worked 99% of the time, you will still have problems due to the law of large numbers. If you have to scan hundreds of millions of content. You have a couple of thousand that can be wrong. So, when dealing a huge amount of data it is extra difficult. And with AI, it tends to be a black box. As we know the inputs and the outputs. But we don’t know how the machine learning model chose that decision. This is the growing field called interpretable AI. So, we have an idea of why a machine learning model makes a decision.
By talking about all of this. Is why we have to deal with AI right now. Not AGI which may or may not happen. And, is far into the future. I heard a saying that AGI is like worrying about overpopulation on Mars. It is a problem but something we don’t need to deal with right now. The machine learning models right now have far-reaching consequences already. With polarising content, public health problems and violence. It is best to fix the issue we are seeing right now. Rather than spending time on a future that may not happen. At the expense of problems of the present.
Sources
- https://www.fast.ai/2018/04/19/facebook/
- I can’t the original source(I remember reading it from stratechery article) where the social media polarising so I have these links talking about it: https://www.ox.ac.uk/news/2018-02-21-social-media-and-internet-not-cause-political-polarisation, https://www.brown.edu/Research/Shapiro/pdfs/age-polars.pdf
Good tech is like good design
Did you know that Apple has custom microchips to improve battery life on its phones? You will only know that fact if you watched the latest WWDC. (which means you’re a nerd 😛). But for non-nerds, they will not notice. At best they may sense their phone runs faster than before. And leave it at that. When using tools (which technology is.) people just want the tool to do its job. Learning why the tool is designed or made in a special way is not that useful to you. For instance, if you just use your car for your everyday commute. You do not care why the internal combustion engine is designed the way it is. Only petrol heads will know why. Same as the technology nerd learning Apple’s custom microchips. Which brings me to the main topic of this blog post. That good technology is like good design. Where the tool just works. And blends in the environment. Almost invisible.
Netflix is one of the most technologically advanced company on earth. They have programs designed to shut down their servers. So, their service is all was ready for a blackout. Have special server boxes they give to ISPs so your show can load faster. And always know what content you want to watch next. But for everyone else, Netflix is just the place where you sit down on your couch after work. And watch some BoJack Horseman. As you scroll through their selections of Tv shows and movies. You are training one of the best recommender systems in the world. Netflix has top-notch data, science teams. Working on how to keep you on the platform for longer. But all of this work you will never notice. As you just want to pick your tv show to wind down. But that’s also why you don’t notice. Because Netflix spent so much time perfecting their system.
Imagine the amount of work involved to develop a system like that. You need to label all of your back catalogues. Which contain hundreds of thousands of tv shows and content. Then after that, you need to group of this content somehow. So, you map relationships between the pieces of content. Afterwards, you to show the content to the user. Then the user picks from the selections. And you adjust the recommendations from there. From that description that is a lot of work. To have a system like that up and running. And most people don’t notice. Which is the whole point.
Like the car metaphor from earlier. If your car worked all the time. You will not need to know how the car worked. Or you need to do is put petrol into the car then off you go. But if it does not work you be forced to open the truck. And check out the engine. Maybe you must fix a leak or jump start your car. But the car is no longer a black box that you can use without knowledge anymore.
Nowadays most companies now use computers to run their business. From accounting to digital marketing. But most companies don’t advertise saying that they use computers. But it is a given. So, how do you know that most companies use computers without checking? Simple, how do you email the company? Where did you find the customer support number? How did you get your receipt? They all require computers. Like the good design metaphor from earlier. Good design is almost invisible. But when it goes wrong you know full well that the company uses computers. Could be because of a hack in their system, Computer maintenance. And many other issues that focus you to know that the company uses computers as that is stopping you from using their services.
Also, most business systems that keep the company running, can be simple. Many small and medium companies. Can just use Microsoft Excel and emails to keep the company going. As anything related to numbers can be done in excel. And anything related to communication can be done with email. Also, if people are in close quarters then email is redundant. But you don’t see companies advertising, they use excel to run the company. Mainly because it’s just a tool. Just to get the admin stuff done in the company. In a chicken shop, the most important thing in your company is chicken. Not the software you use. As the software is a means to an end.
Now I’m going to start crystal balling. In the future, I think AI will eventually end in the same scenario. Where we have AI tools that allow most companies to use AI, without PhD levels of knowledge. This is already the case. In excel and google sheets, machine learning is used to give suggestions to improve your spreadsheet. By adding graphs or changing the format or colours. But we are still a long way away as we still have tons of companies calling themselves “AI-first companies”. Like I mentioned earlier no one calls their company “Excel-based” or “Windows-based”. As it’s a tool. And lots of AI that people are hyping about can be done on an excel page. With a line and graph. So once the hype eventually starts to decrease and lots of brick and mortar or less high-tech remote companies, start to use machine learning tools in their business. Then we can see the larger-scale uses of AI. As right now AI is concentrated in the large tech companies. Which makes sense. As they have the money to hire the experts. And have the data to funnel it into the machine learning models.
So maybe in the future, we will have machine learning tools and programs will be as normal as having Microsoft Excel. Or having a computer itself. Then people can move to the next up and coming technology. Like quantum computing or nanotechnology. And people start calling their start-ups. “Quantum based computing”. The “Uber for quantum computing” etc. The cycle of hype can continue with them.
Collecting data about climate change while valuing privacy.
To deal with the issues of climate change. We will need to collect data, so we have better knowledge on how to deal with the issue. I will first talk about the area of personal carbon footprints. As people will want to personally reduce their carbon footprint. And services that can allow users to reduce their carbon lifestyle can be useful. But to do so services will collect data on your lifestyle to give suggestions to reduce the user’s footprint. For example, if the user gives the service information about his diet. The app can give suggestions to eat less meat and become vegan. But now the service has information on the user’s diet. Which can be sold on to other people. This can produce personalised ads based on the user’s diet. Like a no-meat burger being advertised to user based on their food history. Without the expressed permission of the user. The user can feel their privacy is being violated.
To get an idea of the carbon footprint of the user. The user will need to answer a few questions about his or her lifestyle. Questions about energy consumption. To diet. To transport. With all this information, you have a good idea of the carbon footprint of the person. But also, you have a somewhat detailed profile on the user. From which will prove very useful to ad companies. So, we need to find a way of getting accurate carbon footprints while valuing privacy.
The second is large-scale tracking. Using satellite data, we can track gas leaks from around the world using infrared and other wavelengths to spot gas. But as doing these factories and any industrial services must know any semblance of privacy is gone as they are being watched from the sky. Granted this method proves extremely useful. For finding methane and CO2 leaks. As leaks like those can produce a lot of emissions while flying under the radar.
These two examples allow us to have better information about emissions. But may have traded privacy if we are not careful. The second example is less of an issue. As not all the factories industrial process is being watched. Only spotting for abnormalities for emissions. Mainly gas leaks. Unlike the personal footprint example. Where the service can know your general lifestyle. And that information can be used for purposes other than reducing the footprint of the user.
Some areas were collecting data won't have an issue with privacy. For example, collecting data on energy output on renewables. By doing that we can better match the released energy to the grid. And the is little threat of privacy concerns as this information most all renewable energy users want. Google DeepMind did this and was able to increase the economic value of their wind turbines by 30%. By tracking the demand for energy and forecasting the amount of energy a certain wind turbine will produce.
Another example I’m not too sure about is using satellite imagery to locate renewables around an area. This is used to locate wind turbines and solar panels on people’s roof. There is not a central database where you can see who has a solar panel on their roof. Or wind turbines in their ranch. So, you can use machine learning to spot these items in an image. Sanford researchers was able to do this, with DeepSolar and DeepWind. With deep wind they overlaid the wind patterns on a map. To see which wind turbines will be the most effective at any given time.
While these methods are effective, you are looking at people’s houses to find these solar panels. Is having solar panels something that residents are willing to share? As your looking at satellite data. You're not asking the permission of the homeowner. The wind turbines are less of an issue. As winds turbines are large enough that any person that lived in the local area will know about it.
Another example I think violates privacy but may be worth it. It is using satellite data, to track deforestation. By using satellite imagery, we can see where illegal logging is taking place. As the logging is illegal the reduction of privacy may be worth it. Many of these places were deforestation is happening is on public land. So, if a person is doing something illegal on public property. You can make the case that other people should know about it.
For the internet, positive and negatives are the same
The internet is a great tool. It allows you to connect to people around the globe. It allows you to find knowledge that could never be found in your local library. But it can also allow people to find hateful groups. And find misinformation making the user dumber and more confused. What is the difference between these positive and negative scenarios? They are none.
Connecting people around the globe can be good if you're finding your international surfing partners. But can also mean finding communities that harbour hate. Or finding the wonders of space by reading a Wikipedia article of our solar system. Compared to stumbling upon into anti-vax information. Making people think they are informed when they are not. There is nothing different from any of these scenarios. The positive is normally the same as the negative. Finding information about the solar system vs finding information about anti-vaccination is the same. You were curious about a topic. Then you went on a web page. Then proceeded to learn about the information that the page gave.
After 2016 people started to think about the negatives of social media and by extension the internet. This was prompted by the Cambridge Analytica scandal with Facebook. As people saw these tools as no longer innocent. Not just something that you can share your cat photos. But a place where people will influence the electoral process. But contrary to the issues above. Lots of problems were simply caused by humans using the tool for other uses. (Yes, Facebook did mess up big time. I know)
One the biggest issues were Cambridge Analytica using Facebook data to give you personalised ads. For the election. For example, if data suggests you love small government then Facebook serve you ad showing how the candidate is a libertarian and wants to cut red tape. But what people fail to realise is that that same process was used to serve millions of normal ads. If Facebook data thinks you’re a new mom. Then it will start promoting diapers and baby milk to your feed. The tools and scenarios are the same. The only thing different is the content. After 2016 Facebook made a few improvements so companies can’t abuse your data. And added more safeguards in place. For paid advertising. Like showing who is paying for the advert publicly. Allowing fewer ways for someone to discriminate by race or gender.
One of the great things about the internet is that everyone can have a voice. And can give their opinion to the rest of the world. Some people may not have had an outlet. Now they can share their thoughts with the rest of the world. So, a person wanting to share their point of view for the news of the week. Or a person wanting to share industry news for his colleagues she can do so without joining a magazine. Same with a conspiracy theorist wanting to share his bullet-proof view of the world, explaining the Illuminati and interdimensional aliens. Before the internet, the person would’ve screamed and sharing flyers on his local high street. Now he can just rant on YouTube and share his ideas to an open audience. As we can see the scenario is the same. Without gatekeepers, anyone can share their voice. Good or bad. The human rights activist to the anti-vaxxer. Everyone is free to share their opinions with the world. Regardless of content. Summarising this. The great thing with the internet everyone has a voice. The bad thing with the internet everyone has a voice.
One of the great things about the internet that people share content that interests them almost instantly. If you have a guitar passage you find interesting can share the video via WhatsApp. And they check the video straight away. With the internet regardless of the location you only a few seconds away from your friends and family. Which makes it easier to keep up with what’s happening with your social circle. As you always up to date. But that keeping up to date can be bad depending on the content being shared. WhatsApp is known for its fake news epidemic. Where your boomer parents share some questionable information from a questionable news source. That can be shared as instantly as the guitar video you wanted to share with your friend. What is interesting with WhatsApp or any other group chat app. That it is not algorithmically powered. Where content is not pushed up with a feed. And engagement helps to get further reach. These apps are supposed to be used with the rest of the family and friends. So how is fake news still an issue with this app? It’s simple, like the rest of the examples in the article. Its humans. If a person finds a bit of information interesting, he can share it with less than two clicks. A piece of information being truthful is not related to the question if the piece of content is interesting. Especially if the content is emotionally charged. Yes, algorithmically designed feeds can help prompt emotionally charged content more often. But as humans, if something has more emotions, we are more likely to do something about it. Which means sharing it with more people. They are some WhatsApp unique things people do to get information shared more. Like chain mail. The text may read: “Share this text to 5 of your family members and get £100” or “Share this text 5 of your friends get a free car after clicking this link”. This is an updated form of email chain mail. So even if the technology changes you still have the common Denominator of dealing with humans.
As I gave all these examples about the internet and technology, in general, are great. But for the same reason, they are great. Its same reason why they fall short. When talking about the internet in positive utopia terms. People forget the importance of the words everyone, anything, anywhere. Everyone can create content. Your lovely neighbour to the hate-filled bigot. People can find anything from cell theory to the Illuminati. People can connect to each other from anywhere, from your cousin who moved out of the country. To the flat earthers finding other likeminded people.
Carbon footprint for your shopping list
In this blog post, I’m going to be showing how I calculated a hypothetical family shopping list emission. We don’t know the carbon footprint of the items we get in the supermarket. So, I thought it will be a nice project to work the carbon footprint of an average shop.

To develop a shopping list. I had to match it closer to what most families will buy. I first got a list of general categories that people spent in the supermarket from money advice service.
Here they have a graph showing what the average family buys in the supermarket.

As the list shows the average spent in the UK. I used this as a template to make a shopping list. I started finding items in each category. For example, the first item in the list says, “soft drinks”. So, I googled Coca-Cola and clicked to a supermarket page. Of a 6-pack box of the drink. I copied the price and the name into the notion database. Then I moved one to the next category in the list.
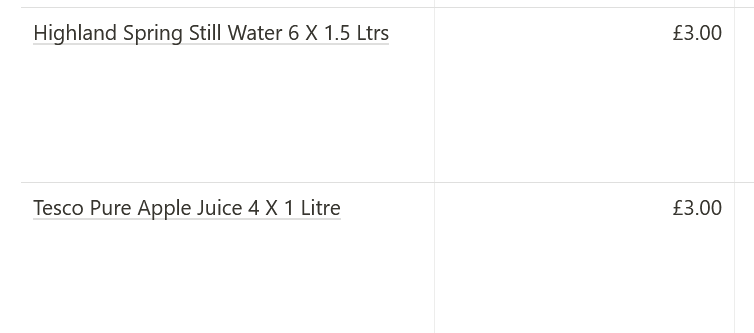
After adding all the items. I started to calculate the carbon footprint. First, I had to find the carbon footprint online. For the highland spring water. It was easy as I found the carbon footprint of one 1.5 litre bottle then I multiplied it by six. As it was a 6-pack item. But this was not done for most of the items in the list. For example, for the apple juice example above. I had to find the carbon footprint 1000 litres of apple juice in this research paper [FIND LINK]. Then I had to find a way to scale it down towards 4 litres.
First, I used this:
90kg co2e per 1000 litres of apple juice
90 / 1000 = 0.09 CO2e per litre
0.09 * 4 = 0.36 grams
I knew the calculation was likely to be wrong, but I was not sure how to fix it.
I used that process for many items for the first time around. For a few products on the list, I calculated the carbon footprint from the amount of protein in the food. I used the data from Our World in Data. To do this I found the item on the Our World in Data copied the carbon footprint it produces into the notion database for reference. Then worked out the protein in the item itself. And used the calculated protein to work out how carbon is generated from the item.
First-time calculations for 6 pack of eggs:
4.21 kg co2e per 100g protein
7.5 protein per egg
7.5 * 6 = 45g protein
4.21kg/100g
4.21 kg co2e / 45g protein = 10.6 co2e
After doing this process for all the items. I found while working carbon footprint out. That I’m dealing with ratios. As process simply working out how grams of protein or net content produces how many grams of carbon. So, as I was trying to out in ratio fashion. I started struggling. That’s when I got to YouTube. To land on a few khan academy videos explaining how to calculate contents from ratios. I used these two videos to help me. Intro to ratios and Rate Problems.
After a few hits and misses, I found a process that worked for me.
Back to the apple juice example:
90-111kg CO2e/1000 litres
https://link.springer.com/chapter/10.1007%2F978-94-007-1899-9_37
We have the carbon footprint from the research paper.
1000 litres = 1000000 ml
90kg = 90,000 g
I convert both numbers into the same units. This major mistake did not see the first time around.
90,000 g : 1000000 ml
9 g : 100 ml
I convert the numbers into a ratio format. The ratio is simplified using this website. For further calculations.
100 ml : 9 g
100/100: 9/100 = 0.09
I swapped the ratios around so I can divide apple juice contents, not the CO2e emissions.
After I convert the ratios into base units by dividing dominator by itself. I used the same number for the carbon number in the ratio.
1 ml: 0.09 g co2e
This is the unit rate. For 1 millilitre of apple juice. We get 0.09 grams of greenhouse emissions.
1 * 4000 : 0.09 * 4000 = 4000 : 360
To match it to the item we have. We multiply the apple juice contents by 4000 ml. (4 pack of 1-litre apple juice) with the ratio. And get a ratio that matches are the item. 4000ml of apple juice produces with 360g of emissions.
This process used for all the items. With adjustments. For different measurements and/or multipacks.
They are some exceptions. When I wanted to work out A “Bonne Maman Strawberry Conserve 370G” strawberry jam. I had to work out two carbon footprints. Because a strawberry jam carbon footprint did not exist.
So, my calculations were here:
370 g
Prepared with 50g of Strawberries per 100g, Total Sugar content: 60g per 100g
This information was found the nutritional information.
50 : 100g berries
100g : 50g berries
100 / 50 : 50/50 = 2 : 1
2/2 : 1/2 = 1 : 0.5
1 * 370 : 0.5 * 370 = 370 : 185
185g strawberries
This section worked out the number of strawberries in the item using the information at the top.
60 g sugar : 100g content
3g sugar : 5g content
5g content : 3g sugar
5/5 : 3/5 = 1 : 0.6
1*370 : 0.6 * 370 = 222
222g sugar
Worked out the amount of sugar.
kg CO2-eq./kg strawberries 0.91 - https://saiplatform.org/uploads/Library/WG%20Fruit%20-%20ART%20Final%20Report.pdf
1kg : 0.91kg
1000g : 910g
100g : 91g
91g berries : 100g co2e
91/91 : 100/91 = 1 : 1.09
1 * 185: 1.09 * 185= 185: 201.65
Now we work out the carbon footprint of strawberries in the product.
201.65g co2e from strawberries
0.6g of CO2 equivalent is produced for every gram of sugar made.
https://www.fwi.co.uk/arable/carbon-footprint-of-sugar-revealed
1g sugar : 0.6 co2e
1 * 222g : 0.6 * 222 = 222 : 133.2
133.2g from sugar
Working out the carbon footprint of sugar in the product
201.65g + 133.2g = 334.85g CO2e
Adding the carbon footprint of sugar and strawberries. To have the total carbon footprint of the item.
Plotting Data
After I was happy with carbon footprint calculations. I wanted to plot them. I did this using pandas and matplotlib.

This was the first plot. Using the footprint and price. I don’t think it’s that helpful. Also, I noticed the y-axis is in the thousands because of grams. But most items are 2,000 grams at most. So, I decided to covert y-axis into kg.

The y-axis looked somewhat cleaner. So, I decided to look for more ways to improve the graphs. This led me to add more columns to the database which may have a closer correlation with the carbon footprint. I decided the add the weight of the item. And protein per 100g. As some items that had high protein may have high emissions like meat-based products.

Got the weight and protein numbers from the supermarket product page.
These are the graphs:


To my surprise, there is less of a difference. But I think some the outliers may be messing with the graph. The biggest outlier in the database is Talia rice 10kg and has a carbon footprint of over 35kg. Most items in the list weigh less than 4kg. So, I replaced with 1kg version. To prevent it from skewing the rest of the dataset.

We can see y-axis is now only 3500 grams. To get an idea which items are we looking at. I created another graph which labels all the items.

Labelling all the items makes the graph look very cluttered. But we can see some outliers.
The one that stands out is ice cream. The Ice cream produces a lot of emissions. The rate of a vanilla ice cream I found from this research paper. Is 3.94 kg co2e = 1kg of ice cream consumed. So for every 1 kilogram of ice cream 3.84 kilograms of carbon equivalent is produced. This is the highest rate of any items that we have on the list. And something that came as a big shock. The little research I have done is normally meat. Mainly beef. With 100g of protein-producing 49.89kg co2e. That is one of the most polluting foods. This is because of the land use. As cow graze the land, they produce a lot of methane. And the land is changed to accommodate this. Which meaning chopping down trees to make for farmland.
Ben and Jerry did a life cycle analysis of their ice cream. And worked one pint (568.261 ml) of ice cream produced 2 lbs (0.9 kg) of emissions. And most of the emissions (52%) comes from the ingredients. Mainly diary. Because of the same issues with beef. Cows produce a lot of methane a very potent greenhouse gas. Methane is 21x more powerful than CO2. Also, Land use change adds a lot to the carbon footprint. Due deforestation to make up for cattle land.
Observations:
As the graphs don’t make it that clear on how much items have the biggest carbon footprint. I sorted the dataframe using pandas sort values. To find the items with the biggest footprint.
df_sorted = df.sort_values(by=['Carbon Footprint (kg)'], ascending=False)

This is the top five items with the highest footprint. As ice cream as the biggest outlier. Then potatoes as far second. But notice these are slightly heavy items the potatoes and sunflower oil. As they weight multiple litres and kilograms. Unlike most items in the list which are simply in grams.
The least polluting items in the list are.
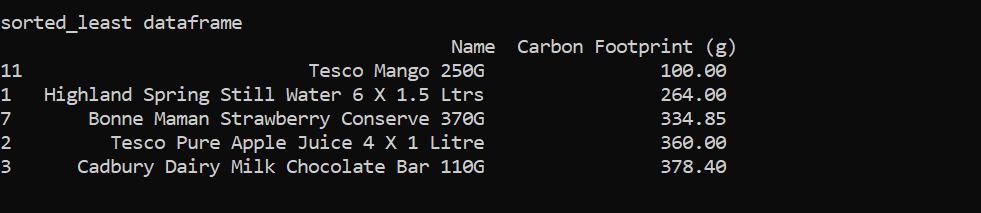
The smallest footprint is mango. As the ratio between a mango and the emission. 1 kg of mango to 0.45kg co2e. Which is one of the smallest rates. Also, the item only weighs 250g so the net content is low. The highland spring water produces a low amount. As for each 1.5-litre bottle, only 45g is produced.
The total carbon footprint of the shopping is 105.97 kg co2e.
This show how much carbon we produce. We don’t do this by purpose. As we have little feedback loops. Highlighting this. We get this problem. A carbon tax may be the answer to have a stronger feedback loop.
Comparisons:
Let’s make comparisons on some of the items in the list.
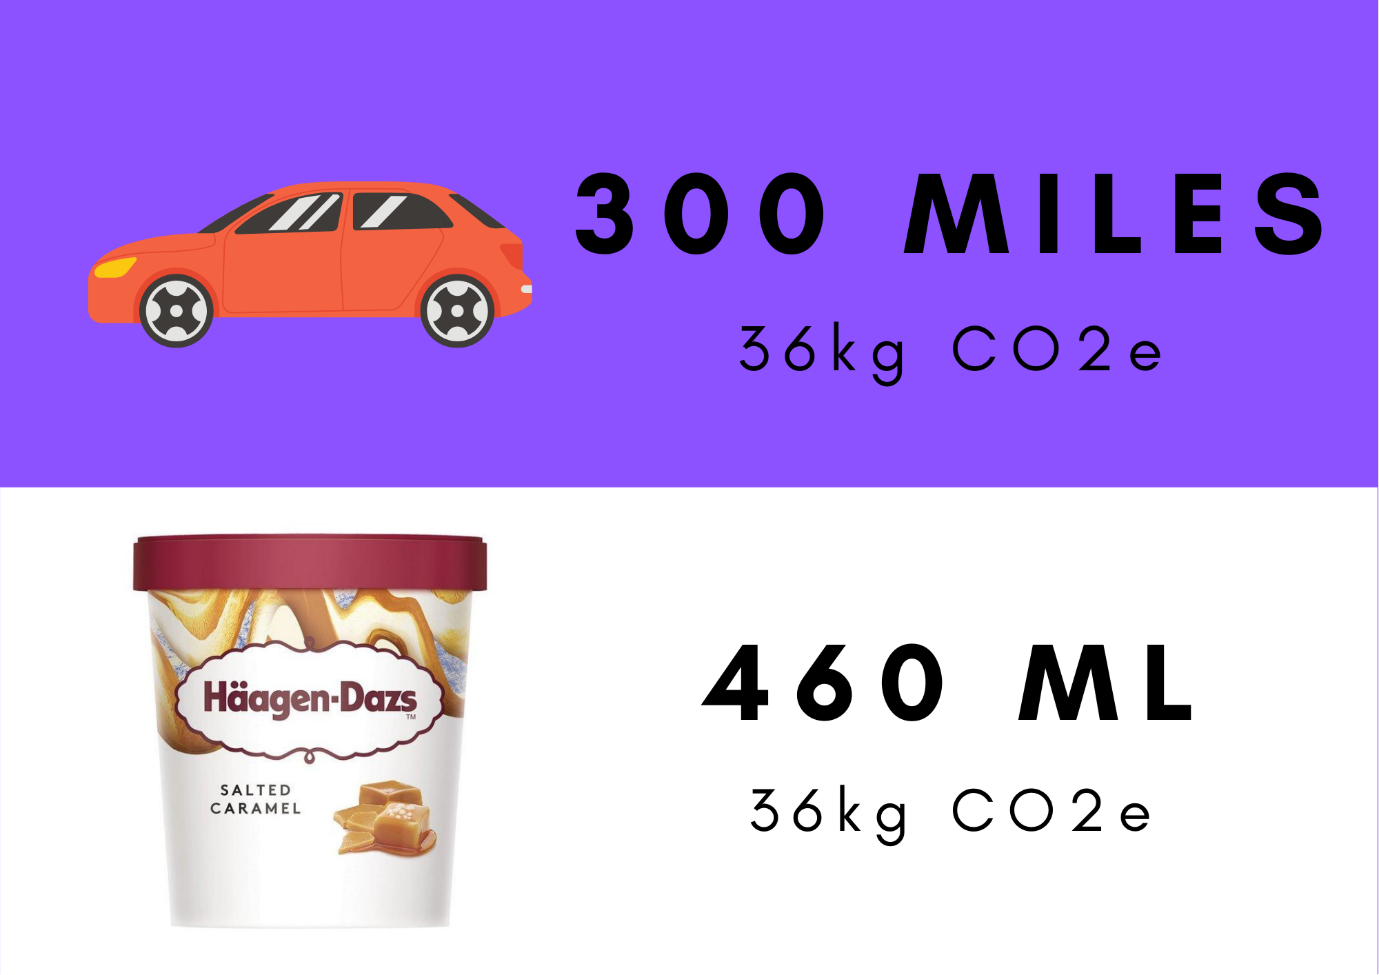
The average new car emits 120.1g/km of CO2 - lightfoot
The ice cream has a carbon footprint of 36.2. Driving a car for 300 kilometres (186 miles) produces 36 kg of co2. So, your ice cream has the has amount of emissions to the short road across your country.
The next comparison is potatoes. The potatoes have a carbon footprint of 12kg. A car trip to produce 12kg is 100 kilometres (62 miles). This can be a simple road trip to escape the city.
Now the total carbon footprint of the shopping list 105.97 kg co2e. A car trip equivalent of that will 880 kilometres (546.8 miles). A trip like that produces 105.6 kg co2e. That’s doing a pretty major road trip you’re going to do.
Conclusion:
Doing regular shopping can create a lot of emissions. Granted most of the emissions are not in our control when we get to the supermarket. As most emissions generated when making the product itself. Long before it gets transported to the supermarket by freight. Transport emissions for food only account for 6% of global food emissions.

But this is not to say all hope is lost. You make personal changes reduce your carbon footprint. You can stop eating foods that have a high carbon footprint. Which means giving up most meat-based products. (I love burgers too much, so I won’t take this advice myself.) But if you are open to the idea of becoming a vegetarian. I will add the numbers to support the point.
· Beef (beef herds) produces 49.89kg co2 per 100 grams of protein.
· Lamb and mutton produce 19.85kg per 100g of protein.
· Farmed prawns 18.19kg co2e per 100g of protein.
· Diary produces 16.87 kg per 100g protein.
https://ourworldindata.org/grapher/ghg-per-protein-poore
While Tofu produces 1.98kg co2e. Oatmeal produces 1.91kg co2e. And nuts only contribute 0.26 per 100g protein.
Modern Theodore Roosevelt
I was reading some information about the US president Theodore Roosevelt. I started getting interested because I had a memory of me watching a podcast in which the guest describes Theodore Roosevelt as his life as a superhero. From watching videos about Teddy Roosevelt, I see why people will think that. I watched a video which told a story of Roosevelt punching out a man with a gun. Think about that for a second, a man brought fists to a gunfight and won. A story I heard is that after he lost an election, he decided to explore an undiscovered river in the Amazon. Which two of the people that travelled with him died. Also suffered a serious illness. That he got hallucinations. But eventually got back to America.
I started thinking that how will a Theodore Roosevelt deal with the modern problems that we a dealing with. For me mainly thinking about climate change. I know that teddy was a huge environmentalist. So, damage to the environment will not be something he will take lightly. Maybe because he helped prompted one of the biggest engineering projects at the time the Panama Canal. Maybe he would have done something similar. Like, have prompted a full transition into a smart grid. Or the biggest Direct air capture plant in the world. I don’t know. But I think he would not have tiptoed around the issue.
I want to read up more of Theodore Roosevelt’s life. As there is a lot more to learn from a person like him. I would like to read his autobiography. And I will listen to some podcasts about him. The Art of Manliness blog by Brett McKay has numerous articles about him. That’s how I originally got to know about teddy a few months or years ago. Mainly from the call of A Strenuous Life. Where teddy calls for people to do hard things. And not to chicken out of stuff. Maybe the reason why teddy was popular for today’s time is because of his “masculine characteristics”. Got into fistfights, when hunting and served in the army etc.
But he sits well with most people because of his inner characteristics. Cared a lot about empathy and leadership. Not modern-day LARPing. Like twitter alphas telling you not to lean in. Or guys flexing on Instagram. Teddy never talked about being a man. He just did it. I guess being a great man is just being a great human being. Reminds me of the Marcus Aurelius quote “Waste no more time arguing what a good man should be. Be One.” The different between LARPing and being one. Is simply taking action.
Maybe that’s what teddy will simply advise us. To simply act. By simply acting we are moving towards the direction of the solution. We can course-correct along the way. But we need to start moving. Teddy seems like he was always on the move. Teddy calls us to get into the arena.
The full quote:
“It is not the critic who counts; not the man who points out how the strong man stumbles, or where the doer of deeds could have done them better. The credit belongs to the man who is actually in the arena, whose face is marred by dust and sweat and blood; who strives valiantly; who errs, who comes short again and again, because there is no effort without error and shortcoming; but who does actually strive to do the deeds; who knows great enthusiasms, the great devotions; who spends himself in a worthy cause; who at the best knows in the end the triumph of high achievement, and who at the worst, if he fails, at least fails while daring greatly, so that his place shall never be with those cold and timid souls who neither know victory nor defeat”
For what I’m thinking about. Maybe we don’t need to talk about how bad a situation is. By how I can deal with the problem myself. I need to put my hat into the ring. Talking is simply LARPing. If you’re not going to do anything about it. I think that goes for all of us. With social media, it is so easy to voice our opinions. Why the state of the world is this way or that way. The algorithms don’t help discussions to become more positive. But with all that, we must ask ourselves what are you going to do about it.
It can be as simple as giving money to a charity that help solves the issues you’re talking about. Or something major like founding a company to fix an issue directly. This reminds me of the concept of skin in the game. When talking we simply don’t have skin in the game. As nothing good or bad is going to happen by voicing our opinions. But when we put our money where our mouth is. By donating to charity. To volunteer our time to fix the issue. Then we have a lot more to lose or win. And are putting tangible actions into place, to deal with the issue.
Lots of the issues I talked about is a lack of skin in the game. Our voice boxes do not match our actions. So, we need to bridge that gap. It is not easy as Roosevelt said but it is more fulfilling and it’s great to put a dent into the world.
“The credit belongs to the man who is actually in the arena” said Teddy. We must try to enter that arena as much as possible. Sometimes we will get punched, kicked, spat on. But it is all worth it to push for a more fulling life. Helping others and making the world a better place. All this is not easy. We can simply go watch Netflix and YouTube and vegetate on the couch. But doing the hard things or having a strenuous life in teddy words. Makes life better for you and everyone around you.