Forecasting time series data with outliers, How I failed
How I got started
I was researching how to deal with outliers for time series data. And it led me to a big rabbit hole.
I noticed that there is a lot of material on how to detect outliers. (anomaly detection). But not much information out there to deal with them afterwards.
I want to detect the outliers for forecasting data. The idea is that you may want to deal with data. With heavy shocks. Think of airline industries after massive lockdowns.
For normal data. There is numerous information about dealing and removing outliers. Like values are in furthers ranges. Then you can remove them. Stuff like z-score etc.
When starting on the project. I want to use time-series data. Which I knew had a major shock. So I choose a dataset. of air passengers in Europe. Due to a major drop in demand in 2020. But while I used it before. I noticed that it was very difficult to select the data I want. So I eventually gave up.
That’s Failure 1
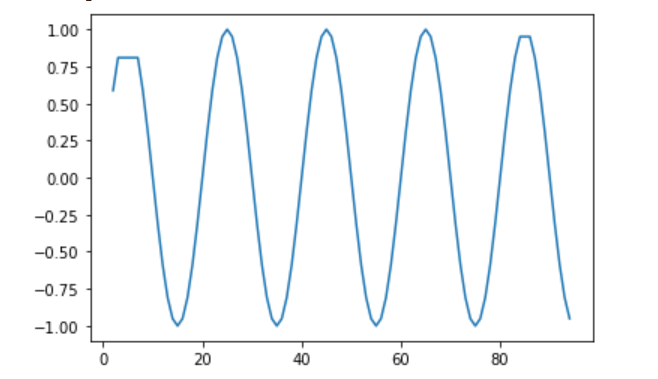
So I thought, I will try to create a fake dataset. That can act like time-series data. So I settled with a sine wave. As this data has a clear trend. (going up and down). Going across time. So I thought this should be an easy thing to forecast.
As I want to learn about the outliers. I manually edited them myself into the dataset.

Finding the outliers
So now work begins detecting the outliers. This took more longer than expected. As I was scrolling through a few blogs posts. Working out how to detect anomalies. I settled on this medium article. While the article was good. I struggled to adapt it to my project.
I noticed the first major roadblock holding me back. I was opting to use NumPy only. As this was used to produce the sine wave data. I thought I can use separate lists and plot them. This made life more difficult than it should be. Dealing with the different shapes of the arrays and whatnot. So I started to use pandas.
That’s Failure 2
Now started making more progress. As it was starting to more closely resemble the code from the tutorial.
For the anomaly detection, I used Isolation forest. As that was a popular technique I saw thrown around. For anomaly detection. And I haven’t used isolation forest before.
The idea was to try multiple techniques and compare them. But taking too much time. The tutorial had the option of isolation forest, so I did that.
There was a bit of an issue plotting the data with markers. But it eventually got solved. By adding a customisation for copying a dataset. For data visualisation.
While it was as able to spot outliers I added. It got a few false positives. I don’t know why.

After I was able to plot the outliers correctly. I decided to work on the forecasting model.
Forecasting the data
I got the code for the forecasting model here. It was not long before I had some issues.
First, I had to fix a minor issue. With outdated import code. By working the new function name. From the auto-suggest feature on Google Colab. I was able to fix it.
I ran into the issue of the data not being stationary. I thought that is something I could skip. With the cost of the model having lower results. But I was wrong. statsmodels could not fit the data. If the data was stationary.
So, I went back to the code as I was plotting the data. And starting work on differentiation. Luckily I already had experience doing this. Just had to get a refresher reading a blog post.
A major thing I noticed that a normal pandas difference did not make the data stationary. So I had to add customisations. Unexpectedly a double difference function. With the frequency set, 20 worked. The sine wave frequency was set at 5. But the same number did not turn the data stationary.
normal_series_diff = normal_df['value'].diff().diff(20).dropna()
After that, I was able to fit the data into the model.
Then I decided to forecast the model. Using the data I train on as a measure. Then statsmodels was giving me Convergence Warnings. And did not print the expected vs predicted values correctly.
Printing it like this:
predicted=-0.000000, expected=0.000000predicted=0.000000, expected=-0.000000
But I was still able to get the graph though:

While the RMSE was broken.
I decided to move on to forecasting the data with the outliers. I did the same thing as above. But this it gave no issues nor warnings.

Example:
predicted=-0.013133, expected=-4.000000
predicted=1.574975, expected=4.000000
As we can see the forecasting looks a bit odd.
A major thing I did not do was changing the model parameters. Nor did I do autocorrelation. To work that out. I wanted to move fast. But in hindsight that may have been wrong.
That’s failure number 4
Now I wanted to forecast the data. With the outliers removed.
This was the code to do that:
outliers_removed.drop(outliers_removed[outliers_removed['anomaly2'] == -1].index, inplace=True)And this is what it looked like:
And I did differentiation with data. So make it stationary. Like I did earlier.
This is the result of the model:

Probably the best one.
With statsmodels printing out real values:
predicted=-0.061991, expected=-0.339266predicted=-0.236140, expected=0.339266predicted=-0.170159, expected=0.057537predicted=0.031753, expected=0.079192predicted=0.095567, expected=0.093096predicted=0.104848, expected=0.097887The aftermath
After all this. This raises more questions than answers. Why did the dataset with missing data? Do the best? While the normal data struggled to get forecasted.
What should one do with outliers in time series data?
Should you just remove it? Like I did. Or try to smooth it out somehow.
How should one create a fake dataset for time series? When I googled the question. People just use NumPy random function. Which I know works. For testing out a toy dataset.
But horrible for forecasting. Due to the lack of any patterns in the data.
I know this because I did a project which I used a randomly generated dataset. Used an RNN to forecast. Due struggled because the data was random.
If you want more failures like these 😛. Check out my mailing list