Bookstores vs income part 5
Click here part 1, part 2, part 3, part 4
Now I have the dataset of the London bookstores complete. I can move on to getting the dataset of the incomes of the London boroughs. In the first article I said they are two datasets that I may use
“One by HM Revenue & Customs which gives the average income of taxpayers by borough, based on survey. Another dataset by the Office of National Statistics, which gives the gross earnings by residence, sorted out by borough.” – part 1
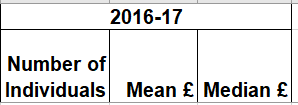
This is the look of the HM Revenue & Customs dataset:

These incomes are based on tax year.
This is the look of Office of National Statistics dataset:

These earnings is based on weekly or hourly times.
I am going to use the first dataset provided by HMRC. As this looks more usable and clearer as size of income can be more easily compared to other values.
I used pandas to open excel file:
excel_df = pd.read_excel('income-of-tax-payers.xls')

print(excel_df.head(10))
Got this result:

This is the wrong sheet being read, first sheet is the metadata of the file, giving general information about the dataset. The data is in the second sheet. This is something I did not think about as I always deal with csv files which only have one sheet to deal with. So, I need to tell pandas to only read the second sheet.
excel_df = pd.read_excel('income-of-tax-payers.xls', sheet_name=1)
print(excel_df.head(10))
I was able to load the correct sheet. But the information that is being viewed right now is not too useful for me. As it shows the incomes in 1999 – 2000. I want to get the latest tax year, so the data can be most up to-date when I use it for analysis. First, I need to get the names of the columns, so I get the name of the column I want to use.
for col in excel_df.columns:
    print(col)

So when selecting the file in pandas I need to select the unnamed columns with the column that has the tax year on it.
tax_year = excel_df[['2016-17', 'Unnamed: 49', 'Unnamed: 50']]
print(tax_year)
The columns were correctly selected but scrolling down a few rows. I noticed they are row that are not needed as they are not related to London.

First, I tried using negative slices but it kept the rows instead of removing them:
tax_year = tax_year.drop(tax_year.index[:-17])

Then a tried a solution recommended on stackoverflow:
tax_year = tax_year.drop(tax_year.tail(10).index, inplace=True)
but I get this error:
SettingWithCopyWarning:
A value is trying to be set on a copy of a slice from a DataFrame

See the caveats in the documentation: http://pandas.pydata.org/pandas-docs/stable/indexing.html#indexing-view-versus-copy
  errors=errors)

None
So I went back to try using negative slicing but I got this:
TypeError: Expected tuple, got str
I updated pandas as I read from this website that having this error means my pandas is out of date. But that only lead to more errors. I had to change the names of some of the columns as pandas started parsing the file differently.
tax_year = excel_df[['Unnamed: 1', '2016-17', 'Unnamed: 51', 'Unnamed: 52']]
I added ‘unnamed: 1’ for the names of the areas. As ‘Area’ does not work.

I added a drop NA function to remove any missing values.
Now there is no NA values in data section:

But this is still the section I want to remove.
When looking at dataframe I noticed that name of the boroughs stop at index 36. So just need to remove from index 36 onwards.

After a few tries I was able to slice the dataframe and cut out the last rows:
tax_year = excel_df[['Unnamed: 1', '2016-17', 'Unnamed: 51', 'Unnamed: 52']]
tax_year = tax_year.dropna()
tax_year = tax_year.drop(tax_year.index[34:])
print(tax_year)

Now we have the data of the tax year I can start doing analysis about incomes and bookstores. I’m going to drop the population column as it may not be to useful for analysis. But I will save the dataframe without the population column in a separate variable so if the column is needed for analysis it can quickly be called upon.
While trying to drop the population column I noticed that pandas does not think of it as a column. Which makes sense as the unnamed columns were used. This is mainly due to the design of the sheet as the tax year is the first row (header). And the other column names are a row below.
This is way the dataframe looks like this:

So want to move the header one row down so it makes it easier to navigate and clear to read when using pandas. Using this answer from stack overflow I was able to change the columns:
new_header = tax_year.iloc[0]
tax_year = tax_year[1:]
tax_year.columns = new_header
And print the columns names to double check
for col in tax_year.columns:
    print(col)
Now I can drop the population column:
tax_year_without_pop = tax_year.drop('Number of Individuals', axis=1)
print(tax_year_without_pop)
I plotted the data into a bar chart to have an idea of the data I’m looking at.
tax_year_without_pop.plot(kind='bar', x='Area', y='Mean £')
plt.show()
Now I need to use the bookstore dataset to match the boroughs they are in. When doing research on how to find a borough name using postcode I found this government website. Where you can type up your postcode then the website returns name of the local authority or borough.

Also there is a dataset which give the postcode to local district and local authority lookup, in the UK.

The only issue is that the dataset is very large (few thousand). So, filtering or searching my 50ish London postcodes my take a while. I am going use the website to get result of the name of the borough.
As I need to input data into website to get the result I want. I need to use some type of automation software. I will be using selenium web driver. Automate the task of typing up the postcode into the entry box. After the website gets the results back I can start using normal scraping with beautifulsoup.
The code design was based on this website and this stackoverflow answer.
The browser was able to load the website but the program though an error before submitting the input.
File "borough_scraper.py", line 14, in <module>
    inputElement.send_keys(Keys.ENTER)
AttributeError: 'NoneType' object has no attribute 'send_keys'
I was able fix this issue by replacing the enter key by using a click button solution.
find_button = driver.find_element_by_xpath(
    '/html/body/div[6]/div[1]/main/div/form/fieldset/div/button')
find_button.click()
But the program scraped the wrong element as I got this:

I was able to fix the issue by navigating to the correct div element. The extracting the first paragraph tag which has the wanted text.
soup = BeautifulSoup(driver.page_source, 'lxml')
result_layer = soup.find('div', class_='unitary-result group')
name_borough = result_layer.p.text
Now I need to adapt the code so it can use multiple postcodes from my filtered dataset. I started by importing pandas to read the csv file. Then taking the postcode column and turning it into a list so it can used for a loop.
df = pd.read_csv('filtered_dataset.csv')
list_postcodes = list(df['Postcode'])

print(list_postcodes)
A for loop is added to all of the scraping code from earlier and is indented into the loop. for postcode in list_postcodes:
print(df['Bookstore name'])

driver.implicitly_wait(15)
print('Waiting ...')
driver.get(url)
…..
print(name_borough)
names_boroughs.append(name_borough)

driver.quit()
At the bottom of the loop the names of the boroughs are appended into an empty list, called names_boroughs.
After I make a new column in the dataframe. Using the names_boroughs list. Then produces a csv file with the new column.
df['Borough'] = names_boroughs
print(df.head())
df.to_csv('filtered_dataset_boroughs.csv')
After running it for the first time. I had to do few edits. First it kept on printing whole bookstore name column, for each iteration in the loop.

Then I got this error:

So I added a sleep function after the value is added to the list.
print(name_borough)
names_boroughs.append(name_borough)

time.sleep(10)
print('Waiting ...')
I ran the program again but got this result:

Check that the issue is about the postcode TN. I checked that any of the TN postcodes that I have are in London. I found that none are in London. So, I deleted them from the dataset.
Ran the program again got the same result later on:

I checked the postcode in the dataset that is mostly likely going to be outside of London and near the area that the program is searching for, which is KT13 8AB.
Googled the postcode:

Checked the city that googled gave for the postcode:

From the description the bookstore is not in London, So I deleted it from the dataset.
Did this again for another value:

Value in the dataset: Walton-on-Thames,"12/13 The Heart Shopping Centre, Walton-on-Thames, KT12 1GH",KT12 1GH

Did this again for another values:


After deleting the non-London values. Got a new dataframe and csv file with the borough names.


Some bookstores that are not in London slipped into the dataset. On the 4th value on the first image it says the borough is Thurrock council which is not a London borough. This is because it does not produce the error that the non-London values did.

As can see in this image the website only produces one result. But a postcode outside of London:

The website returns two local bodies and the class used to extract the name of the borough is not used. Beautifulsoup can’t navigate the HTML as the class is does not exist on the page. This is why it throws an error when a non-London postcode is passed into the program.

This is class used for the first result on the image above. Which is different from the class used for Beautifulsoup.
Also, the csv file has the index of the dataframe. But this is an easy fix as can just set the index variable of the function to False and it will not write the csv file with numbers.
df.to_csv('filtered_dataset_boroughs.csv', index=False)

Bookstores vs income part 4
Now as the town column is not needed, I want to drop this column. Using the pandas drop function should be able to drop it from the data frame.
dataset_df = dataset_df.drop('Town', axis=1)
I was able get the results I wanted:

Now I’m able to start filtering out the dataset based on list of postcodes I created earlier. I first tried using the isin pandas function but all values back false or non-available.
filtered_dataset_df = dataset_df.isin(Postcodes)

filtered_dataset_df = dataset_df[dataset_df.isin(Postcodes)]

Then I noticed that the isin function probably won’t work because it is checking for the value itself in the list and the column. Which it won’t be able to find because the list of the postcodes are simply the stating letters of a full postcode. Due to this I will probably need to use regex again, so it can match the prefixes postcodes from list to column.
More visual example of the problem: This is the strings that pandas are looking for:
Postcodes = ['EN', 'IG', 'RM', 'DA', 'BR', 'TN', 'CR', 'SM', 'KT', 'TW', 'HA', 'UB', 'E', 'EC', 'N', 'NW', 'SE', 'SW', 'W', 'WC']
But pandas is going through the data that looks like this:
PR1 3NN

TW9 1TN  -> Pandas is not going to get this as ‘TW’ is not a separate string.

SY1 1SJ

EH15 3RD

CV37 6AU

S1 2FB

DD1 3DG
So, I need to develop a new regex pattern that can be used to match the letters from the list. While working on the regex pattern to match the first to letters of the postcode developed this draft.
[EN]{2}[0-9]|[IG]{2}[0-9]|[RM]{2}[0-9]|[DA]{2}[0-9]|[BR]{2}[0-9]|[TN]{2}[0-9]|[CR]{2}[0-9]|[SM]{2}[0-9]|[KT]{2}[0-9]|[TW]{2}[0-9]|[HA]{2}[0-9]|[UB]{2}[0-9]
This is simply first two letters of the greater London postcodes. With a quantifier only asking for two letters. And also, a number character set to match a number after the first two letters of the postcode. This stops it from matching the second half of postcodes which may have the same letters.
This is what it matched while testing:

It got the matches I want but some incorrect ones. Like ‘DD1’ I did further tests with EE1 and DD2. The problem stems from the character sets allows duplicates of characters that are in the character set. For example [DA]{2}[0-9] allows DD2 because the ‘D’ character is in the string and character set and meets the quantifier of {2}. Also, the number ‘2’ is the third character and meets the [0-9] character set. Later on, I was able to fix the issue by changing the regex pattern.
[E]N[0-9]|[I]G[0-9]|[R]M[0-9]|[D]A[0-9]|[B]R[0-9]|[T]N[0-9]|[C]R[0-9]|[S]M[0-9]|[K]T[0-9]|[T]W[0-9]|[H]A[0-9]|[U]B[0-9]I reduced the size of the character set to the first letter of the postcode. This made it so the program will only match the first character before moving to the second. This stops duplicate characters from earlier as only the first letter can be matched once. I was able to develop regex pattern for the second half of the original regex pattern focusing on inner London.
[^A-Z]E[0-9]|EC[0-9]|[^A-Z]N[0-9]|NW[0-9]|SE[0-9]|SW[0-9]|[^A-Z]W[0-9]|WC[0-9]Like the first pattern but I added negated character sets next to the postcodes that only have one letter. (E, N and W) So it does not match with other letters containing the same letters. For example, a postcode that pattern without a negated set was TW9. This is not what I wanted as TW9 is already a separate postcode with the TW match. Before negation:

After negation:

I combined both of the regex patterns into one:
[^A-Z]E[0-9]|EC[0-9]|[^A-Z]N[0-9]|NW[0-9]|SE[0-9]|SW[0-9]|[^A-Z]W[0-9]|WC[0-9]|[E]N[0-9]|[I]G[0-9]|[R]M[0-9]|[D]A[0-9]|[B]R[0-9]|[T]N[0-9]|[C]R[0-9]|[S]M[0-9]|[K]T[0-9]|[T]W[0-9]|[H]A[0-9]|[U]B[0-9]
I created a variable that uses regex pattern to see if there are any matches in the column.
filtered_column = dataset_df.Postcode.str.contains(London_postcode_regex)

As we see the functions works as most of the values return True. But I want to return non-Boolean values.
So, do that created another variable which changes postcode column using the contains function, while return all of the dataframe. I used this page to help me create the line of code.
dataset_df = dataset_df[dataset_df['Postcode'].str.contains(London_postcode_regex) == True]
print(dataset_df.head(10))

As we can see, the filtered dataset has mostly London postcodes. (TN31 1PJ is not a London postcode but the regex passes it through because of TN31. I tried to adjust the regex to stop it from matching but to no success.) To see the whole dataset, I think it’s a good idea. Export the filtered dataset. To do this I just need to use the df.to_csv function.
dataset_df.to_csv('filtered_dataset.csv', index=False)

Now we can see the filtered dataset. I think it did a good job. But when looking at both datasets I noticed that some bookstores have slipped through and did not captured in the filter. Did my own manual regex search on the dataset and found these:
Searching using E[0-9]:


Searching using N[0-9]:


Searching using W[0-9]:


As pattern forming from these postcodes that did not get captured are single letter postcodes. I guess that the negation of character sets affected the search of the postcodes. And also the combination of the inner and outer postcodes regex may have affected the search. To test this hypothesis when to extract these values and put them in a separate file, so could manual use regex to use if they match.
Searching without negation:

Searching with negation:

Adding negation does not seem to affect the matching of the postcode.
I changed the pandas’ function of contains to match to see if that changes anything.
dataset_df = dataset_df[dataset_df['Postcode'].str.match(London_postcode_regex) == True]
Looking at the dataset I can see that it did not make a difference. Mainly looking at the amount of values in the dataset.
Adding negation does not seem to affect the matching of the postcode.
I changed pandas function of contains to match to see if that changes anything.
dataset_df = dataset_df[dataset_df['Postcode'].str.match(London_postcode_regex) == True]
Looking at the dataset I can see that it did not make a difference. Mainly looking at the amount of values in the dataset.
Using Str.contains:

Using str.match:

As the non-filtered values all have contain London in their bookstore name. I think I should filter down based on the bookstore name containing “London -” a small regex pattern may be needed. I can also use the greater London postcodes separately as those bookstore names do not contain “London -”. Both of these separate searches could be combined into a filtered dataset, having the values of the bookstore name search and the greater London postcode search.

filtered_greater_london = dataset_df.Postcode.str.contains(Greater_london_postcode_regex)
filtered_inner_london = dataset_df['Bookstore name'].str.contains(London_bookstore_name_regex)
dataset_df['Greater_london'] = filtered_greater_london
dataset_df['Inner_london'] = filtered_inner_london
dataset_df = dataset_df.drop(' Street_name', axis=1)
print(dataset_df.head(10))

I dropped the street name column so printing results can be more neat. Looking at the preview of the first 10 rows of the dataset, I can say it went well as pandas correctly spotted which ones are in Inner London and greater London. Now I just need to take these columns and put them into a separate file. Tried this code to convert the Boolean values into strings (postcode, bookname)
filtered_dataset = dataset_df[dataset_df[['Inner_london', 'Greater_london']] == True]
print(filtered_dataset.head(10))
But I got this instead:

I was able to covert the Boolean values of the greater_london and inner london by applying Boolean indexing into the columns directly.
non_bool_filtered_greater_london = dataset_df[
    dataset_df.Postcode.str.contains(Greater_london_postcode_regex) == True]
non_bool_filtered_inner_london = dataset_df[dataset_df['Bookstore name'].str.contains(
    London_bookstore_name_regex) == True]
print(non_bool_filtered_greater_london.head(10))
print(non_bool_filtered_inner_london.head(10))

Next I combined the columns using the pandas concat() function.
frames = [non_bool_filtered_greater_london, non_bool_filtered_inner_london]

result = pd.concat(frames)
result = result.drop(' Street_name', axis=1)

print(result)
This picture is smaller preview of the print statement.

Now I used the df.to_csv to make a new dataset with this dataframe. Also commented out drop of the street name column. So it can be in the csv file.
result.to_csv('filtered_dataset.csv', index=False)
As we can see the new values added into the dataset, which was not there before:

Bookstores vs income part 3

I was able to get quite a few results. But there's more to this than meets the eye. There lots of places in London that does not have ‘London’ as their town address or a postcode.
I will show an example in the dataset to illustrate the point:

From looking at these two examples you would not think that the second address is not apart of London as it does not have ‘London ’ anywhere in its address or have a London postcode (N, NW, SW, SE, W, WC, E and EC.) But if we google where Romford is, Wikipedia gives us this answer:
Romford is a large town in east London and the administrative centre of the London Borough of Havering. -Wikipedia
So Romford is apart of London with little indication. This is mainly explained because of the London postal district does not cover all of London (Mainly greater London).
This picture from Wikipedia highlights the issue:

Greater London split into the London boroughs superimposed with the London postal district (red)
-https://en.wikipedia.org/wiki/London_postal_district
Now knowing this information, we can’t use a simple find and search with the string ‘London’. We need to use Greater London postcodes with normal London postcodes to capture all the London postcode in the dataset.
First I want to make a list contain all the London postcodes. (Greater and Inner) Which can later be used to filter down the dataset.
This is the list of postcodes, the postcode are in strings.
Postcodes = ['EN', 'IG', 'RM', 'DA', 'BR', 'TN', 'CR', 'SM', 'KT',
'TW', 'HA', 'UB', 'E', 'EC', 'N', 'NW', 'SE', 'SW', 'W', 'WC']
After I import pandas so I can start filtering the data. Using pandas I parsed the data set and printed the first items.
dataset_df = pd.read_csv('dataset.csv')
print(dataset_df.head())

First I thought that I dataset is fine but I noticed that the bookstore name looks like in place of the index column. So I tried to get the key of some of column names so it can print out values of the column or data type.
I got errors like KeyError: 'Town' and KeyError: 'Bookstore name'.
I added a skip_row variable to 1. Then pandas was able to give an index column but was using the first data entry as a column name.

I also tried using a dataset with no quotes. By using code editors find and replace. But the pandas was not able to parse through the dataset as extra commas from the street addresses added extra column to file.

Then I was able to print out the data types inside the dataframe. I got this result:

Looking at this means the program counts all column names as one batch of data.
Looking back at my scraper code I noticed the issue lied where I was setting up the column names.
dataset_writer.writerow(['Bookstore name, Street_name, Town, Postcode'])
As we can see all of column names counts as one string. Which explains why the column names where quoted in the csv file.

Now after changed the column names into induvial strings I ran the scraper again and then fed it into pandas. Using the head function, I printed the first 10 results.

As we can see panda recognises the rest of the column names. Also a index column is also appears on the result. But as we can see the columns of Town and Postcode are empty. This is because the quotes that cover the address make the programs count them as one whole block. Like the column name issue from earlier.
Thinking that if I can find a way of dropping the rest of the street address except the postcode then I can move on to the next step. This is because I will be using the postcodes to filter dataset.
What I can do is use pandas features and regex to extract the postcodes from their address and have them in a separate column.
From this stack overflow answer I found a pattern that I can use to extract the postcodes from my data frame.
I stored the regex in a variable:
Postcode_regex = '[A-Z]{1,2}[0-9][0-9A-Z]? [0-9][A-Z]{2}'As the regex values looks a bit too long for it to directly used in a pandas function without looking messy.

Below I have breakdown on how the regex pattern works. The highlighted areas correspond to the areas of the postcode the regex is dealing with.
• [A-Z]{1,2}: The first section of the pattern checks if the first letters of the postcode are letters. Which is why the character set covers the alphabet [A-Z]. The quantifier {1, 2} matches the character set [A-Z] only once or twice. So only 1 or 2
characters allowed to be matched.
• [0-9]: The second section matches the first number in the postcode.
• [0-9A-Z] ○: Third section matches character that is a letter that is a number or letter. That’s why the character set contains 0 to 9 and A to Z [0-9A-Z]. The question mark makes the character set optional. This is because a few postcodes don’t have a 4th character. For example (EC1 6KH, PA2 6NH). ○ Is just a placeholder character to symbolise a space character, this is need so it can move on to the second half of a postcode.
• [0-9]: Matches the character to a number, same as the 2nd section.
• [A-Z]{2}: This section matches letters with a length of 2 characters. Similar to the first section but it must be two letters in a row, or it won’t match.
To extract the postcodes, I used the pandas extract function. I borrowed the code from this page.
dataset_df[' Street_name'] = dataset_df['Postcode'].str.extract(Postcode_regex)
I got this error:
AttributeError: Can only use .str accessor with string values, which use np.object_ dtype in pandas.
I later found out I was setting up the columns the wrong way round. As the variable name defines the new column name not the column I’m extracting from. So I changed it as you can see below.
dataset_df['Postcode'] = dataset_df[' Street_name'].str.extract(Postcode_regex)
The code should move the extracted postcodes to a new column. One error popped up run running the code. I got this: ValueError: pattern contains no capture groups. But this was easily fixed by adding parentheses to my regex pattern string, like so:
Postcode_regex = '([A-Z]{1,2}[0-9][0-9A-Z]? [0-9][A-Z]{2})'
Running the code after I fixed the issue, I was able to get successful results:

Now as the town column is not needed, I want to drop this column. Using the pandas drop function should be able to drop it from the data frame.
dataset_df = dataset_df.drop('Town', axis=1)I was able get the results I wanted:

Bookstore vs Income part 2
Information about the bookstore stored around this layer.

Using the bookstore_info variable I want to extract the name and address from the elements inside the div. To do this I need to create a loop the find_all function makes an iterable so I will be able to use this for the loop I want to develop.
The idea of the loop I got from this page: https://realpython.com/beautiful-soup-web-scraper-python/
I was able to develop this loop:
for each_bookstore in Bookstore_info:
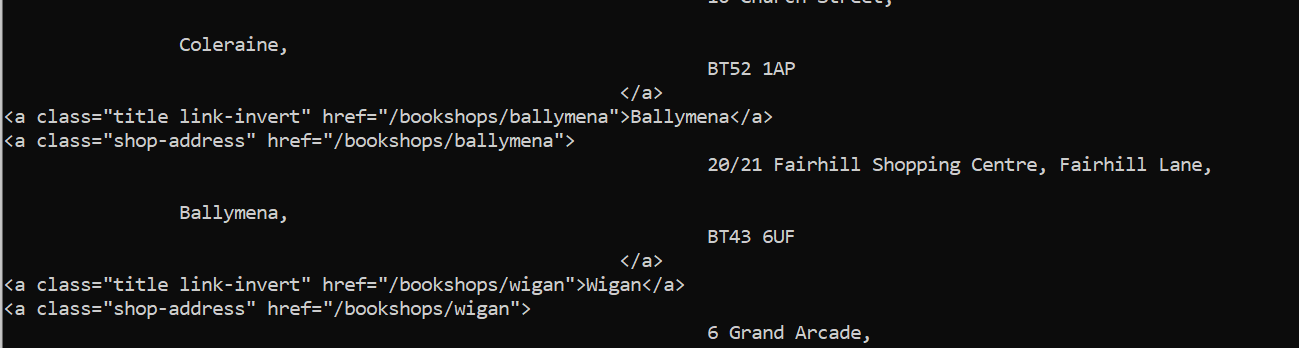
name_of_bookstore = each_bookstore.find('a', class_='title link-invert')
address_of_bookstore = each_bookstore.find('a', class_='shop-address')
print(name_of_bookstore)
print(address_of_bookstore)The loop iterates through each 'shop-item span6 mobile-span12’ from the bookstore_info variable. Then using the find function which is different from find_all as it only returns one result. It finds the element which the title is stored in (anchor tag) and the class (‘title link-invert'). The next line does the same thing for the address of the bookstore.

The last lines of the print statement of results of the loop.
But I still have of hanger-on HTML tags. By adding .text to the output was able to get remove the tags.
print(name_of_bookstore.text)
print(address_of_bookstore.text)
But I have lots of whitespace, so it looks I need to add the python strip function and added a line break between name and addresses to make it more clearer:
print(name_of_bookstore.text.strip())
print('\n')
print(address_of_bookstore.text.strip())
This removed a lot of whitespaces but still some around the addresses:

I made simple text file to see if the problem is not just my anaconda prompt messing with the output:

As we can see the format is still messed up.
From looking around to fix this issue I found out the main source of the problem is the text from the HTML itself. Mainly that it already has odd formatting that later shows when extracting it.
As we can see below, I double-clicked the text and shows the amount of whitespace around the address.

I was able to find the solution from this stack overflow answer. The question was asked to remove the whitespace in a string but keep the whitespace between the words. A similar issue that I have as I want to keep the whitespace in the addresses so it still makes sense.
seprated_address = ' '.join(address_of_bookstore.text.split())
I added the prints statements saying the 'Bookstore name: ' and 'address_of_bookstore: ' to make the output clearer.
I tried different solution earlier where I used str.replace to remove all the whitespace from the address variable, but this made the addresses unreadable. One of the major issues that it had that it deleted the space between the postcodes which is hard to add back as it just a string of numbers and letters.
By adding a few newline statements when writing the text file and the print statements for the output, the format is significantly improved:


Now I have the format of the address fixed. I want to convert the text file into a CSV for the dataset. Or simply change the python file opener to write CSV files instead of text files.
If I want to make a CSV file using this data. Like I mentioned earlier I need to adjust how the file is written. CSV files are written by rows. So the ‘Bookstore name: ’ and ‘Bookstore_address: ’ strings will need to go. As the CSV file will count them as data entries. The best move is for the strings to the top row and use them as column names. The ‘Bookstore_address: ’ string may have to be adjusted as the addresses themselves have commas between them making separate columns in a CSV file. I may change spilt the string into street name, town, postcode. As this is the order of the address inside the data.
Here is the file writer adjusted to make csv files:
And the produced dataset:

As we can see it worked very well. I just need to adjust the quoting setting for the file, so the quote marks on the file can be removed.
Also, I need to add a way that it can scrape the rest of the pages. As this dataset is based on the first page on the website. When looking at the URL for the other pages a small addition is added to the end of the URL:

The page/2 is added. When moving to the other pages the number only changes. For example, page/3 and page/5. Using this knowledge, I need to create a loop with increasing the number at the end of the link.
I used some of the code design from this blog post.
I made a list of a number going up to 15 (As this is the number of pages in the website.) It gets to turn into a string so it can be used to attach to the URL. Afterwards, a loop is made iterating through the list, inside the list a request is made to the website. A ‘/page/’ string is added at end of the URL so afterwards the page number can be added.
Below that, an if statement checking if the request gives a successful status code. If not, then a message will be printed. Afterwards a 10-second delay before moving with the rest of the code. This is done so the scraper does not overwhelm the servers and get my IP address banned.
The CSV file produce only showed the last page. This is likely because the CSV writer is inside the page loop to it resets itself each time there is a new page.

Now I moved the CSV writer outside of the loop, all the data is now in the CSV file:

While going through the CSV file. I noticed that the column names were written into the file multiple times.

I think the problem is where the CSV writer of the column names is placed. There are placed inside the loop of the pages. As they were not moved when I adjust the file writer.
After making changes the issue is fixed:

Bookstores vs Income data science project part 1
The goal of this project will be to use data to find out whether if there is a correlation of between the location of a bookstore chain called Waterstones and the income of the borough. Waterstone is one of my favourite places to visit in London. As it has a wide selection of books and their shops are great place to stay if you plan on reading one.
I wanted to do a data science project as I haven’t done one in a while. As the goal of the project is to simply find correlations, the project model will likely use a simple linear regression.
Now the first step for any data science project is to get data. For the location of the bookshops the waterstones website gives information about the locations of the stores. The default view sorts out bookshops by alphabetical directories:

But clicking the view all button the page we can all of bookstores with less separation into different pages.

By having it like this it makes the website more easier to scrape. As I can only navigating 15 pages compared to 24 with the alphabetical view.
To collect the income data of the London boroughs there is two main datasets I’m thinking of using. One by HM Revenue & Customs which gives the average income of taxpayers by borough, based on survey. Another dataset by the Office of National Statistics, which gives the gross earnings by residence, sorted out by borough.
Developing a web scraper
The first step I want to do is to create a web scraper, that will take the addresses of the bookstores and store in a file for later sorting. As using the search function on the website is not too effective.
In the image below I typed up London but does not all the bookstores in the city:

Below the map the website shows a list of the bookshops. This is the information I want to scrape.

Going through the inspect element options on my browser we can see how the html is design for the list:

The div class="shops-directory-list span12 alpha omega section" holds the dictionary of the bookstore elements.
Then div class="shop-item span6 mobile-span12" holds the element of the individual bookstore.
From that div class the information of the bookstore is located in the child tags.
We can see a level below the “inner” tag contain information about the bookstore.

One more level down leads to the textual information about the bookstore like the name and address.

This “info-wrap” div class gives me all the information I want from the bookstore. As from here it has the title of the bookstore and the address of the bookstore.
To create the scraper, I will be using beautiful soup to extract the HTML content and I will be using the requests library for the HTTP request to collect the HTML from the web.
I was able to print out the contents of the HTML from beautiful soup like so:

Now I need to navigate to the section where the information of the bookstores are.
From printing the body tag using print(soup.body.prettify()) I was able find area where the bookstores where but there is lots of other not relevant information in the HTML.

So, need to zoom in more in the HTML hierarchy. To get to the element where the bookstore information is located, I need to travel “sideways” across the HTML tree. As the one of the div element is located on the same level as the div with the useful information.

So, I used the beautiful soup navigation and used the next_sibling tag to get to the “main-page row” div. But when I ran the code, I got this error:

Deleting the next sibling tag got me this:

This is the div element on the first level. But this element is not needed as the useful information is in the second div. Doing the same as earlier but without using the prettify function. print(soup.body.div.div.next_sibling) gets me nothing:

Later on, I was able to access the div element I wanted using find_all function. Saved the navigation to the parent element of the starting div containing the information of the bookstores in a variable.
main_container_div_element = soup.body.div
From there I searched the div by class then printed the variable out.
find_div = main_container_div_element.find_all('div', class_="main-page row")
print(find_div)

Found another way to find the “main-page row” div. By saving the navigation of the first sibling is located. I was able manually cross sideways by using the next_sibling tag multiple times.
sibling_2 = first_sibling_div.next_sibling.next_sibling.next_sibling.next_sibling.next_sibling.next_sibling
print(sibling_2)
The one advantage about this way that it does not come within a list. But with the previous solution I can simply use a key next to variable where it will give me the chosen number from the list. Like this:
print(find_div[0])Now using further navigation, we can move deeper into the div element where the bookstore information is located. I used a find_all function again to move one level deep into the div element. Doing like this is easier as the div element I wanted has other siblings as well.
find_div_2 = find_div[0].find_all('div', class_='shops-directory-list span12 alpha omega section')

print(find_div_2)
Now I used the find all function to move a level deeper and collect the siblings of this element. This was done as the div class “'shop-item span6 mobile-span12'” contained information of the individual bookstores.
Bookstore_info = find_div_2[0].find_all('div', class_='shop-item span6 mobile-span12')
print(Bookstore_info)
Same div classes containing information of other bookstores.

Information about the bookstore stored around this layer.

I will work on extracting the information in this layer on the next blog post.
Developing a habit tracker website part 5
Just finishing the arrow buttons. In the last article, we just finished developing the logic on how the arrow buttons will change the date displayed on the website. The function was only set up for the left arrow button for testing purposes. Now we can use the code for the right-hand arrow which moves the date to next month.
Before:
After:
Now we need to call the function in the click event:
$("#right_arrow_button").click(function() {
  next_month();
});
Now we can test the button:

Clicking the button does not do anything. Reviewing the next_month function I saw that the function did not have a way of increasing the current month number. So copied this line:
(currentMonth + 1) % 12from the medium post into a function to see if it will work.
The result below:

The button was able to change the month of the website. But it did not change the year. When I checked the function again I noticed that the line where the year was supposed to increase was not assigned to a new value.

I corrected it to year = year + 1.
Now the date correctly changes the year and the month:

Now we need to adjust the number of days on the calendar according to the date selected. This was mentioned in the last article. I was able to get a half solution for month February where I hide the last week so only showed to 28 days. But this solution messes up the toggles for the calendar’s days. And stops them from adjusting.
Also in the last article, I was able to copy a function that retuned the days of the month. So it can be used for this task. Now we have variables containing the month and the year, I can input these into the function. But I need to find a way to adjust jQuery toggles of the days knowing the number of days in the month. To do this probably need to make a couple of if statements to toggle certain days based on the month.
After some research was able to make some progress. To deal with the calendar day individually I had to turn them into an array.
list_week_5 = $(".week5").toArray()Then produce a for loop iterating some of the lists. I added red borders to test if the loop is working.
for (var i = 0; i < 3; i++) {
  console.log(list_week_5);
  $(list_week_5[i]).css( "border", "3px solid red" );
The length of the for loop is based on the number of days between the current month and the rest of the days. For now, I have it at 3 so it easier to test.
I replaced i < 3 with the difference variable as the value captures the number of days needed to iterate. To get the rest of the days captured by the loop I added a plus 4 to the difference variable representing the days in the calendar minus the current month.
Now we have example of number of days used in the function using handpicked numbers for February. We need to add a way that the function can adjust to new number of days in a month.
This is where I use the days in month function from earlier. I added this line to calculate the days of the current month.
current_month_num = daysInMonth(month_num, year)Then added to the difference variable:
difference = 31+4 - current_month_numI tested the function, it did work but not how I expected.

As we can see the boxes did adjust but it only reduced the number of boxes, leaving leftover days from the another on the calendar. This January 2020 so red boxes should appear only around the 1st and beyond.
Like below:

I think it a problem with the loop as it counts up from 28 then reduces the amount based on the difference variable.
I tried to adjust the loop by making it count backwards from 7:
for (var i = 7; i > difference; i--)But I got this:

I added a console log command to the difference variable. To see the number contained the value.
I got this:

The variable has a value of 4. But the only 2 red boxes appear. So it may be a miscalculation with for loop that only gets 2 boxes.
Another option I’m going to try is reversing the list then using the for loop to count normally. I did this by .reverse() function on the array creating a new variable like so:
var list_week_5_reverse = list_week_5.reverse()I was able to get this result:

This is the result I wanted as it highlights the days that not involved in the current month.
But with further testing I found march incorrectly highlights the days of March 2019:

March 2019
I think the problem is that the red box borders do not change when the days that should be highlighted decrease. When testing the function more by adding to the right arrow I learned the when moving to future months, the boxes did not change when I moved them back.
From console logging the difference variable each time the arrow button was clicked:

You can see the variable changes according to the current month. So problem is probably about the CSS addition in the function.
$(list_week_5[i]).css( "border", "3px solid red" );I was able to add a minor fix by setting the borders to 0 before the for loop starts.
$(list_week_5[i]).css( "border", "0" );When testing the button I was able to get the month to change back:
January 2020 before

December 2019

January 2020 After

But the borders are missing for the rest of the week. So I need to adjust the CSS again.
I decided to copy the border properties on the from calendar day and used it to replace the border zero line.
$(list_week_5).css( "border-right", "1px solid #e1e1e1" );
$(list_week_5).css( "border-top", "1px solid #e1e1e1" );
When running the code I got this when switching back to the previous month:

Some the original borders remain on the days 29 and 28 but on the 31st-day red box is only partially taken away.
Later I found a solution which was to put back the border none line before adding original lines back:
$(list_week_5).css("border", "none");
$(list_week_5).css( "border-right", "1px solid #e1e1e1" );
$(list_week_5).css( "border-top", "1px solid #e1e1e1" );
In the next blog post I can work on adjusting the calendar days as i now have a way of highlighting the days that are not included in the current month.
Developing a habit tracker webiste part 4
Now we need to adjust the number of days in the calendar. As currently, it displays 31 days for February.

February has 29 days, so I need a way it can be adjusted. Not too sure how to do so as the days are coded into the HTML:
<div class="calendar__week" id="week5">
        <div class="calendar__day day">29</div>
        <div class="calendar__day day">30</div>
        <div class="calendar__day day">31</div>
        <div class="calendar__day day">1</div>
        <div class="calendar__day day">2</div>
        <div class="calendar__day day">3</div>
        <div class="calendar__day day">4</div>
      </div>
First, need a way to calculate how much days are in a month. From googling around you can create a function that takes in month and year then gives the number of days in the month. I copied my example from this stack overflow answer.
function daysInMonth (month, year) {
            return new Date(year, month, 0).getDate();

          }
          console.log(daysInMonth(7,2009));
I used the console log so I will get an output of the number without putting it on the website.

As I simple measure I added a hide function to not show the last week was the days was not included in February.
$("#week5").hide();
This works for showing the days in the month of February but not the other months. I need to add another option were to can switch to another month like March or January. I think this will be done by developing an arrow button navigating to the previous month or the next month.
Using this page I added arrow buttons to the website:

The left side button has a green colour to it as that was the colour copied in the code. I edited it so both colours had grey which fitted colours scheme of the website better.
This was done by changing the background colour hexacode of the next button to the same attributes as the previous button.
Now the buttons look like this:

Before I start working on adding scripts to change the month of the website. I want to move all of the JavaScript code to a separate file. The scripts are making the HTML file harder to navigate.
Here is an image below of some of the HTML file:

When I first loaded the website with the external file, the JavaScript did not load at all. I found the solution was to add the script tag later in the document rather than the head. As the rest of the elements need to be loaded. So the functions can find the elements when they are loaded. This stack overflow answer gave a good explanation and solutions.
Now the JavaScript file looks this:
Now back to the goal of changing the month of the website. Using the arrows buttons, we can either navigate to a new page or change the status of calendar day classes. The advantage of making a new page for the new month that previous entries in the calendar can be easily separated or saved. But the disadvantage is that having a new page for every new page will become less manageable. The class option makes it easier to scale with a lot of months. But I will need to find a way to save entries of the previous month when togging the classes.
I will be using the calendar day class option as this seems like an option that can scale with the user changing a few months before or ahead of time.
To trigger a click event on anchor tag is not different from making click event from the previous elements. I copied a piece of code from Quora answer.
$("#left_arrow_button").click(function() {
    alert("Your anchor is clicked.");
});
I added ids to the anchor tags to make the click event work.
The left arrow button should give an alert when it is clicked. This will give me evidence that the click event is working correctly.
The result below:

We can see the experiment worked. Now we can work on the calendar will change when the buttons clicked.
First, the simpler step is to change the date when the button is clicked. So when the next button is clicked it moves to march 2020 and if the left button is clicked it should change to January 2020.
To create the logic I will need to reuse some of the code earlier for producing the date. I’m basing the logic of the next month and previous month on this medium post. I’m just converting the one line if statement to normal ones so they are easy for me to read.
When testing the button I got this:

So the function does not have a way of returning the month.
When looking at my code I noticed that my month variable is accessing a list not a number.
var month = months[d.getMonth()];
Compared to the medium article:
currentMonth = today.getMonth();So I created a new variable. That only takes the number of the month not the result of the list.
quick explanation: The month returns the name of the month by accessing a list of the name of months.
var months = ["January", "February", "March", "April", "May", "June", "July", "August", "September", "October", "November", "December"];This is first done by creating JavaScript data object.
var d = new Date();The getMonth() function gives a number from 0-11 of the date.
“In JavaScript, the first month (January) is month number 0, so December returns month number 11. ”
The number produced from the getmonth() function can be used an index number for the list. Which is how we get this: var month = months[d.getMonth()];
The new variable created was this: var month_num = d.getMonth();
This retuned only the month number
Only I changed the variable so the function can complete the if statements. The last lines used the new variable to access the list of the name of the months. Then inserted into the HTML document.
The changed worked well as the picture shows below:

Also changes the year as well:

Habit tracker project part 3
In the previous article, I ended it when I finished applying the jQuery solution the two first week of the calendar. Now I need to apply the solution to the rest of the days of the calendar. Also, I want to allow multiple views like one week. And switching to other months.
The website already has a toggle option from the template from codepen:

But the toggle is not active or linked to anything. So will need to add my own scripts and other HTML code to get it to work. My first goal for editing this toggle is to allow the click the week button and change colours. To do so I added a script based on the example code this page. Close to the area where the div classes for the toggles lie.
The result I got is this:

I think the problem is that it does not select the CSS properly for the class. As when clicked the box(border) is not rounded and the text is changed to lower case. I later found the fix where I deleted the “toggle__option” and kept toggle__option — selected. I generally thought that all that counted as one class. But I was wrong, what probably happened that the previous solution inherited the properties of both classes, not one. And it caused it not to do too well.
<script>
   $( ".toggle__option" ).click(function() {
   $( this ).toggleClass("toggle__option--selected");
   });
</script>
A minor problem that both toggles can be on at the same time.

And also, off at the same time:

The closest I’ve found to creating this solution was adding an if statement into the function, which turns month button class when the week button is toggled. It only half works as the I can’t toggle back into the month button without turn off the week button.
After a few hours of iterating the code, I found the solution. The solution did not need if statements as we can assume the class change from the click event. I used the id attribute instead of the toggle_option div class. As the toggle option class contained both buttons. After toggle class of the clicked ID property, I added another toggle class a line below which changed the class of the other button. Used two functions to operate actions so it does not interfere with the other button.
Now the next stage is to change the view of the calendar using the toggle. I think the solution for this feature is to have the options button connected a script that will toggle the rest of the weeks in the calendar.
First I added ID to the div classes of the calendar weeks:
<div class="calendar__week" id="week2">
        <div class="calendar__day day">8</div>
        <div class="calendar__day day">9</div>
…
<div class="calendar__week" id="week3">
        <div class="calendar__day day">15</div>
        <div class="calendar__day day">16</div>
…
Then I added jQuery toggle functions under the week toggle button code.
The jQuery toggle function simply hides or show selected elements. Compared to toggleClass which I used in the earlier code, which toggled the class of the selected element.
When testing it out got this result:

This was a successful test, as the weeks have been successful hidden and click event for the cross still works. And switching back to month toggles the rest of the weeks back.

I later found an error to the solution above. The week will only toggle back if you click the week button. This means if you clicked the month button to toggle back and see the full view of the calendar then it would not do anything. Only the button will change the status to selected. So I needed to click the week button twice to toggle it back.
Luckily the solution was easy as I just need to copy the toggles from the week function into month button function.
$("#month_toggle_button").click(function() {
        $( this ).toggleClass("toggle__option--selected");
        $('#week_toggle_button').toggleClass("toggle__option--selected")
        $('#week2').toggle()
        $('#week3').toggle()
        $('#week4').toggle()
        $('#week5').toggle()
      });
Now the next stage is to update the dates and the calendar to the current time. And also allow the user to navigate to other months.
To get the current date and time I used the JavaScript date object. Copied an example from here.

<div class="current-month" id="current_month">June 2016</div>
      <script>
          var d = new Date();
          document.getElementById("current_month").innerHTML = d;

      </script>
As we can see it prints out the whole string. So need to add more tweaks. I added another line to get the current year and added line get the current month.
<div class="current-month" id="current_month">June 2016</div>
      <script>
          var d = new Date();
          var months = ["January", "February", "March", "April", "May", "June", "July", "August", "September", "October", "November", "December"];
          document.getElementById("current_month").innerHTML = months[d.getMonth()];
          document.getElementById("current_month").innerHTML = d.getFullYear();

      </script>
But the text only shows las inner HTML line which is the current year.
I found the solution by editing the code so the month and year get stored in a variable. Then combined into one variable to be used as a string.
The GitHub link for this current project is here.
Habit tracker project 2
In the previous article was working on how I will apply the cross to the calendar dates. The options included images or HTML diagonal lines. I decided to settle on using the image cross. As the design looks much better than on the website compared to the CSS lines I made.
Here the comparison below:

I guess that I could have spent more time editing the CSS lines by making sure lines fit perfectly in the box and line correctly. But considering the amount of time spent just trying to get it to this stage makes me think it’s not worth it.
So the step next is to allow the user click on the calendar date then a will cross appear. As the symbolises the user crossing off the day and continuing the chain. From researching how to do so I noticed that will using JavaScript. Django and flask still ask for JavaScript code to do an action like this. And I’ve not set up Django or flask yet, so if I still need to add JavaScript rather python code then it is not worth the hassle installing those frameworks.
To develop the click action I needed, I went to this website explaining how to click events work. I copied their example code to test if the element is clickable.
The test did not work as the element was not clickable or showing extra text.
After hours trying to find the solution I finally got the example code working:

To fix the issue I found that I that to replace getElementsByClassName to getElementById. Which means making an ID attribute to the calendar day.
My issue that is makes the code more tedious as I need to add an ID attribute to every calendar day.
While trying the find the solution I found a method that sort of works. The technique is that you wrap an anchor tag over your div element, this makes the div element clickable. But the issue for me that because it uses a link to make the element clickable. It can link to another website or page. Not changing the div element show extra text or an image. Unlike the solution above.

I screenshotted two days to highlight the fact using this method, removes the border on the right-hand side.
<a href="http://example.com">
        <div class="calendar__day day">5</div>
</a>
While testing the on click solution using JavaScript. I noticed that when you move your mouse the pointer did not indicate the div element of clickable. So I added a short line of code to CSS which makes the calendar day elements shows the hand the pointer.
.calendar__day {
  border-right: 1px solid #e1e1e1;
  border-top: 1px solid #e1e1e1;
  cursor:pointer;
}
Now we apply to want I’ve learnt from the example code to make the cross image appear when a user clicks the calendar day. When first testing I did not the image to load. It only returns the text.

<div class="calendar__day day" id="day5" onclick="myFunction2()">5</div>
        <script>
            function myFunction2() {
              document.getElementById('day5').innerHTML = "cross icon.png";
            }
        </script>
The fix I found out that I needed to use an img tag in the middle of function to work. Like so:
document.getElementById('day5').innerHTML = "<img src=cross icon.png>";But I got this result:

From looking from the Firefox developer tool I noticed the path for the image was not set up correctly.

The image file is called “cross icon.png” so the HTML file is only taken “cross” a bit of the text. So I renamed the file cross_icon.png so the HTML does not mistake the whitespace.
When I clicked the calendar box I got this:

This was my mistake as forgot for the example cross from the last article I changed the height and width. So I copied and pasted the same image tag to my function so the properties set up in the last article can be used. Now I got it to work correctly:

A sight issue I have with this is that it replaces the number of the calendar with the image. I think it would be nice to still have the date on the calendar day, even when the issue gets the cross. To fix the issue I found that I can add the number of the day and a line break tag before the image. When setting the innerHTML.
Another feature I want to add is for the user to reverse the click event. So the image will disappear when the user clicks the image or box. And come back once the user clicks again. As right now after the user clicks the box the image stays.
I was testing an example which toggled the size of the div element. But didn’t know how to use to my scenario where I use an image. As the code used the CSS tag to make it work.

<div class="calendar__day day" onclick="show(this)">6</div>
        <script>
            function show(elem)


        </script>

.wide {
    width: 50px;
}
I found a solution to the problem by using jQuery. By using a function that toggles the image.
A minor tweak I need do is to have an image hidden first before user clicks. The solution I found for this was to add display:none CSS property to the image tag. So now the image starts hidden and the user can click the calendar day and the cross will appear.
Now the next step is extending this solution to the other calendar days. First, I complete the first week as right now it looks like a mishmash of text and crosses from me setting up solution and example code from earlier.

Here is the code of the image above:
As we can see it’s a bit messy. As I’m simply copying the solution into other calendar div class it should not be too hard to fix.
Now, this is the calendar after the editing:

Habit tracker project
The idea of this project is to make a project that will simply at ticker for a given day if a person successfully does his tasks. This is based on the concept called the don’t break the chain. Which popularised by Jerry Seinfeld in which the story goes that we wanted to get better at writing jokes so he decided it would be beneficial to write new jokes every day. And had a calendar where on each day he adds an X over the day after doing the task. After a while, a chain will develop the goal would not the break the streak.
There are websites and apps that already do this. There is dontbreakthechain.com and one I used to use called habitbull. In habitbull, it had a percentage score where it will be based on how well steak is going. And gave extra stats like the number of entries, average count for the week etc. My main goal for the website is making a python version of this. I think I would be using Django or flask as it is likely to be an online web application. One of the major issues not sure how to address is the design as the app of habitbull used circles connecting to each other. The dontbreakthechain.com uses a straighter forward design of a simple calendar which I will imagine.
Habitbull design:

Don’t break the chain website design:

From using the inspect element tool from the browser I think the website is mainly writing JavaScript. Which is why I think a don’t break the chain version of the project will easier. As this means it can probably be done with Django.
When I was researching closed thing I found to the habitbull design in HTML form was this demo website. The website is actually a planner but this closest I got to the habitbull type design. One of the issues, if I followed through with this design, is that how will I implement circles connecting to each with HTML and CSS like the app.

This is another demo that similar design to the app, this one is simpler on the code.
Another design I’ve just thought of is having a design based on empty boxes where the user can put a cross over the calendar when the task is complete. Like these paper calendars below. My guess it will be much simpler to develop this with HTML and CSS rather than the earlier mentioned design. As it is closer to the don’t break the chain website with simplicity.

I will be moving ahead with the paper calendar design as it will easier to add the cross over the day or a different colour for the day. The closest HTML equivalent of this is a demo called CSS grid calendar.
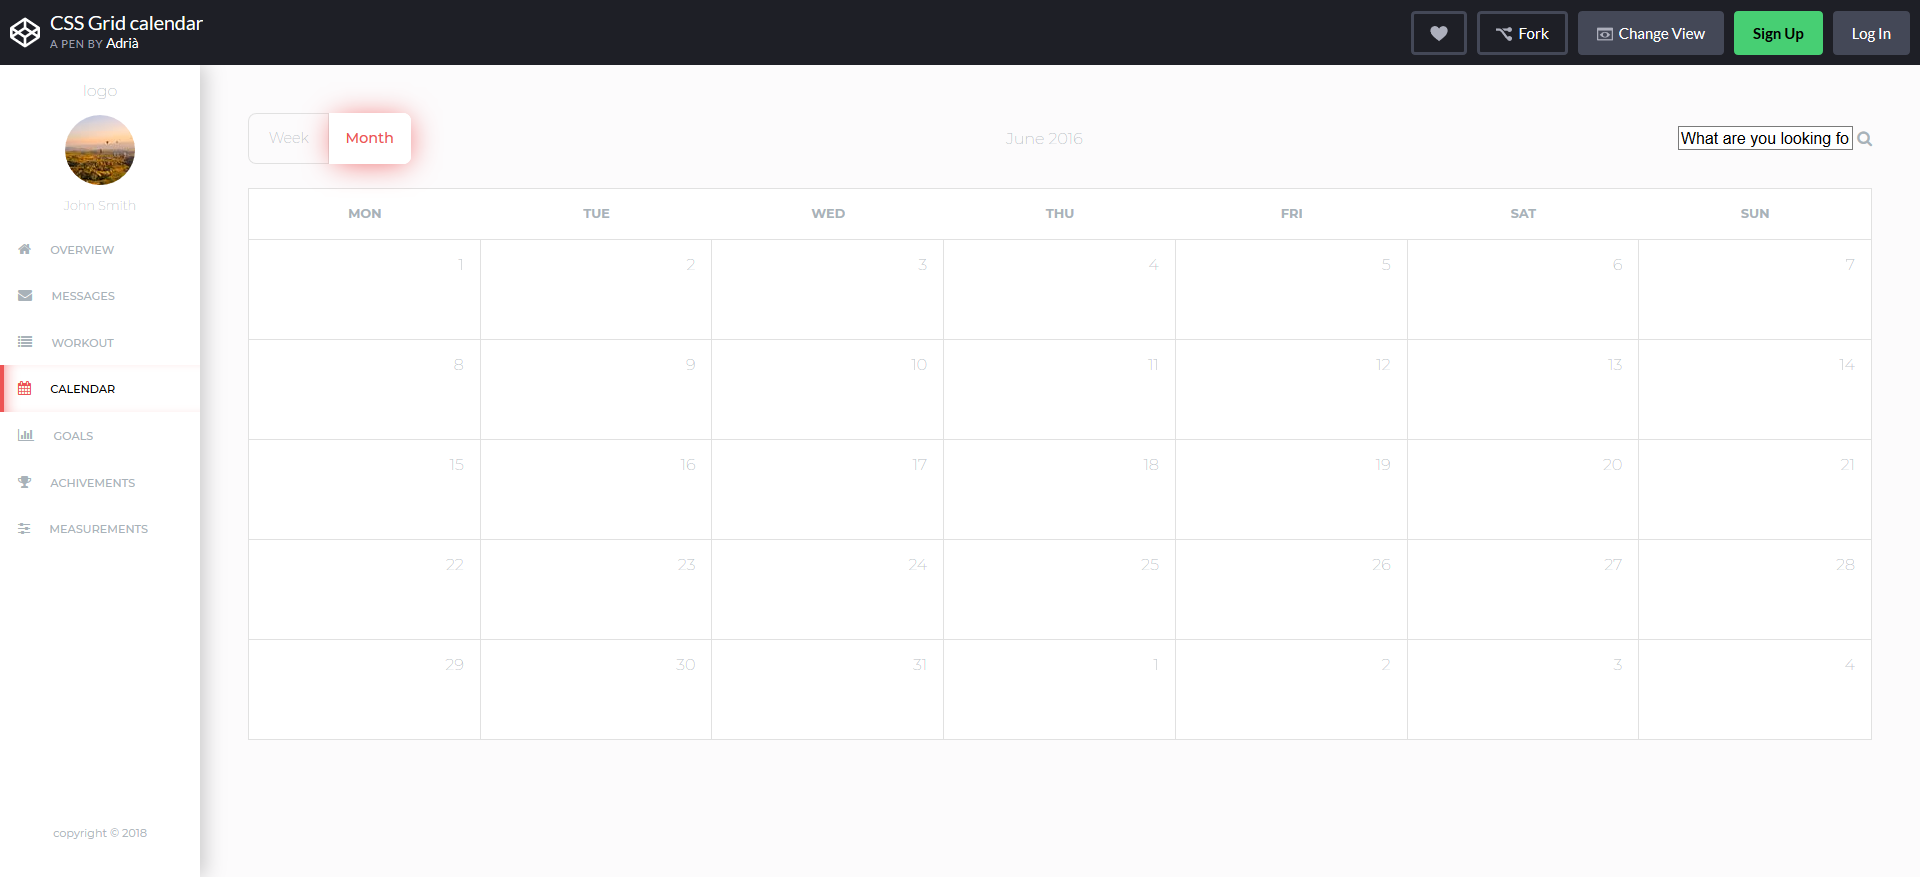
So I made a local version of the calendar. By copying the code from editor section. When copying the code the local version looked like this:

When I worked out you need to copy the links from the settings of the website to add the head tag.


After adding these links to the head tag like so:
Now the website looks like this:

This looks the same as the code pen version which is good. Now from here, I edit the files so I can delete all the unnecessary bits of the website. And making sure the calendar is the main function.
So I don’t break anything on the website won't be removing anything yet. But will be focusing on add cross or a colour change to the calendar to signify when a task is complete.
For awhile I was trying to create a new line under the number. After fiddling around a simple br tag inside div tag works. It was weird because it was not working earlier

I added a cross image I found from google to one of the calendar days:

This is done to test the design out. Another option is using a cross that made SVG or HTML using to diagonal lines.
The code of some testing mentioned is below:
To add the lines using the CSS code I copied code from this stack overflow answer. Showing one line got me this:

Then when I added the second-line it was outside the box and it ended up here:
Changing the CSS property of line 2 from absolute to relative got me this:

Which is better but lines not aligned or reach the end of the boxes. From fiddling around with the code a lot did not find a way to make a cross for the calendar day. One of the issues was dealing with increasing the line size without increasing the border's size.
I over-exaggerated the example below to make the issue clearer:

After more fiddling around with the properties for while I was able to get this:

The closet I got to make a cross using the CSS and HTML. A beta version of the cross.
I later changed the border-bottom properties to black and making the lines thicker:

The lines are not inline or the correct length but this is done enough for now.